iBankCoin
Joined Mar 24, 2016
17 Blog Posts

A Week Full of Buy The F-ing Dip

WEEKEND JOURNAL
Saturday June 4, 2016


Weekly Summary:


  • Buy the Fucking Dip

Very few developments this week, as the market continued to digest it’s rally from the previous week of trading. We are now in a small 20 point trading range where every attempt to push the market lower failed. Even off what many would consider a disastrous jobs report, buyers stepped in. The bearish thesis is hard to see here other than a tactical short against the April High, which I am sure many are doing; so if we do breakout, it will likely be epic.

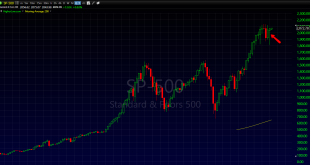
The cleaner more obvious trade to watch for right now is a breakout above last week’s highs and then continuation above the April highs, which will trigger the cup/handle shown below. The target is 3.5% higher setting new All Time Highs in the S&P. This pattern is  Priority Numero UNO. Not the Jobs Report, not the Fed-speak next week, not Br-exit. None of it matters! The only thing that matters is where price is going. And a breakout above these levels targets all time highs.

I will use Friday’s lows as the Area to re-evaluate the bull thesis, and will calculate risk/reward off of that.
~75 points of upside for ~10 points of downside.

Looking at the DJIA, it too has a bullish Inverse H&S pattern, that is also yet to trigger, but is on our radar.  We’ll want to be on alert for a bull trap setup much like we saw on the bear trap 2 weeks ago, but never the less, the trading plan is well defined on this one. I will use that VWAP off the lows (orange line) as my area to re-evaluate. I won’t want to be long below it, but I will get back in if it loses it and then regains it. Certainly a possible scenario. If that area is lost and starts to become resistance rather than support, we will probably be looking more bearish, so stay tuned this week to the nightly reports.

With all the bullish talk here, I still believe that April high is critical and do remain a bit skeptical until it is taken out with conviction. The reason being, we have seen these retests of the rally high fail time and time again since last May.
Taking out that swing high from April, will certainly change that pattern. This is an area near the top of a very large 2 year trading range. So we want and need to trade the price action, but respect that there is still resistance ahead.

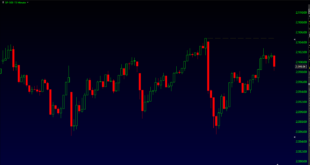
Looking at the Russell: Something that would garner more bearish attention is if the 115 level fails to hold. It did on Friday. However the Momentum divergence could cause an epic move lower if 115 fails to hold.
This still looks far too much like December to be comfortable. Nothing to think about above 115, but below it could get ugly fast. Failed Breaks with Momentum Divergence == Fast Move

Breadth

Slight improvement in breadth this week despite a pretty flat week in the markets.


The Bottom Line:
We are in the exact opposite situation as we were in 3 weeks ago. We have very bullish setups targeting all time highs with resistance still above. It will be important here to have a plan to trade these patterns with proper risk controls in place. I laid out my thoughts above, (i.e where I would re-evaluate, take risk off until those levels are held again). We also want to be on alert for bull trap reversals on breakout (much like we saw in the bear trap). Remember, we are still in a 2 year trading range. We have to trade what we see, but be on the lookout for changes in the plan and react. At the moment there is very little bearish thesis to work with, but watch that Russell very closely. Stronger Yen and a failed move in Russell will likely take everything with it.
 

This Week’s Chart’s in Focus:

Let’s review a few charts that I consider worthy of your attention:


Emerging Markets (EEM): A few of you asked me about EEM this week. We have an inverse H&S setup worth watching for sure. However, there is massive overhead supply above, which needs to be respected. If it can regain and hold 36, it could be a good long. Remember, this area is still resistance until it is not.  The measured move is ~48 so there will be plenty to be made if that zone can be regained and become support.

Yen: We talk about this one every week. This is supposed to be the risk off asset, so has many including myself scathing their heads. This guy is about to breakout of it’s cup/handle formation. In theory, not good for equities. So we want to continue to watch this closely. It certainly increases my skepticism about the US indexes, but we don’t have bearish price action to work with in the indexes just yet. 

DBA->Agricultural ETF continues it’s move for the 23.59 Inverse H&S target. Look for this one to flag at some point for entry. Something like the drawing below. Flags with a bullish base below make great trades.

IBB-> I was engaged in a Twitter debate over this one this week. Until 290 becomes support again, there is no long term bull thesis. There was a small inverse H&S in the pink box below on lower time frame, that played out to it’s target this week.
Great. Now you wait. It is sitting 10 pts below major overhead supply. I am not saying it can’t do it. but why would one be chasing this into this kind of resistance? When resistance becomes support again you want to be a buyer. Let this one prove itself now, is all I am saying.
This looks very much like December still. A nice rally, lower high and then it rolled over. This time may be different, but let it show us.


All of the charts and commentary below are provided as information only and do not constitute a trade recommendation nor investment or trading advice. Any investments, trades, and/or speculations made in light of the ideas, opinions, and/or forecasts, expressed or implied herein, are committed at your own risk, financial or otherwise

Comments »

Major Technical Rally Acquires Target…Now we wait.


Wednesday May 25, 2016

The following is  be used for Informational purposes only. The charts are fact, however my interpretation is an opinion which I am sharing with readers. None of this is a recommendation to buy or sell anything. You must do your own due diligence. 


Key Developments :


  • S&P acquires it’s measured move target. 
  • Be on the lookout for the next tradeable setup as we grind into major resistance above.


SUMMARY :

I have always done a daily journal entry as part of my daily routine. I started sharing it in the 4th qtr of last year on my site and people have found it quite useful. After a major technical target was acquired, I figured I’d share with the peanut gallery today.


Let’s get going……
Today the S&P 500 acquired its measured move price target of 2090.69 on the SPX and 209.42 on the SPY (SEE CHART ABOVE). After which the market spent most of the day consolidating in a tight yet volatile 5 point trading range.


We looked as though we were setup to move into 2100 area with a nice Cup/Handle with an Inverse H&S in the handle, but that breakout was sold pretty aggressively. (As I always say, it is okay if a pattern fails. They still offer you probability and risk management as we learn and know exactly what to do when it doesn’t do what it should). In this case I might have lost 1 point with the potential to make 5 or 6 if it completed, which more often than not it will. However, we are clearly pressing our luck up here. 

This failure tells me sellers are up here as we should expect so despite the move over the past 4 trading days, we still want to be cautious as there is major resistance into and above the 4/20 highs.  We have 3 unfilled gaps below to now fill and the risk reward has shifted here to the bears at least until the 4/20 highs are not only taken out, but proven to be support. I certainly will not be chasing a breakout up there if we are to get there without a very well defined risk reward setup.


Going forward, I will not short this blindly, but I have no choice but to continue to be skeptical up here. We just have to wait and see what price action develops here, but no reason to press either way. I am in trim and trail mode with my longs, although I have no index exposure here. I trade my targets, take my profits and wait. I tried to trade this cup/handle but was stopped out for a small loss, then I shut it down for the day as the edge here is small for my strategy. 

This feels a ton like December, where we chopped around up and down with several ping pong patterns each direction until ultimately the bottom fell out.  BTW, it was very trade-able in both directions. I crushed it in DEC because the technicals were clean like this last rebound off the lows. 

Maybe  this time is different, I know there are many that think it is, but nobody has a  crystal ball, all we can do is trade what we see. Right now, there is very little to see after a 3.5% rally of Thursdays lows that completed an inverse H&S pattern and is running into major resistance. 

What we do here now with no real minor price action is we go back and look at the big picture.

Yes, this still could be a H&S top, despite the short-squeeze on the failed breakdown, however It’s still a lower high. We just want to watch for price action that might tell us we are reversing.

However we can not ignore that taking out the April High, the October high and the May 2015 high, which still lie above would put this larger cup/handle pattern in motion. Which could trigger a monster move to the upside.
There are 3 swing highs that would need to be taken out of for that to happen, so we must continue to monitor the lower time frames for clues of a breakout or a failure. We have nothing to work with yet.


The Bottom Line:
The S&P has rallied 3.5% off it’s Thursday failed breakdown low and completed another inverse H&S pattern today. At this point, we have very little to work with, so we must remain patient until we do. Typically we will some very choppy trading as the next move sets up, either higher or lower. Continue to follow me out there on twitter during the day, and I will post what I see. 


Comments »

Morning PEP Talk 5/24/2016

All of the charts and commentary below are provided as information only and do not constitute a trade recommendation nor investment or trading advice. Any investments, trades, and/or speculations made in light of the ideas, opinions, and/or forecasts, expressed or implied herein, are committed at your own risk, financial or otherwise


SUMMARY:

Futures are higher this morning after yesterday’s very tight low volume trading range.

It appears we are triggering an inverse H&S after holding the VWAP from Thursday’s low yesterday. Let’s see if shorts who chased and played the H&S from Thursday and didn’t trade it correctly start to get nervous and  cover, which could squeeze this thing higher.

The issue here is the swing highs and the trend resistance to compete with, so I plan to be very selective with long entries as chasing into these resistance levels can be dicey.
The SPY measured move is 209.42, so there is meat on the bone for this pattern we just want to trade it wisely with risk reward in mind. As we saw last week, pattern failures do happen, it is knowing what to do when they do that makes patterns so great.


That’s the plan. Now we must execute and profit!

Have a good day of trading.

If you would like this report by email, please send an email to [email protected]


Comments »

Here is the path to take the market higher

Last week I spent a ton of time talking about and making a very big bearish case for stocks. Then again, in this week’s weekend journal, I discussed the fact that it felt to me like this was just an OPEX bounce held up by the real lack of a complete bearish catalyst, and the dynamics that draw price toward the max pain points on OPEX.

However, I have trained my brain over my years of trading, to be very very flexible, and to listen and observe the price action and ignore every other thought and or bias. I so badly wanted to go into swing mode last week after the breakdown and just sit back and ride the trade into the target. However, the reversal pattern into the close Thursday and the follow through Friday, forced me to change my original plan. What this did was trigger a bear trap back into the H&S top range, and we must take that very seriously and consider the bearish thesis very possibly wrong.

Another thing that caught my attention which I outlined partially here, is that the risk on indexes (Biotech and Chips) caught a bid, while some of the risk off vehicles saw weakness (Metals and Japanese Yen). It may be nothing, but to completely ignore it is just plain ignorant, and there is no room for ignorance in my trading. As they say, being wrong is fine, staying wrong is not. So the trader and analyst that I am, decided to flip it upside down and try to find some price action that might start making a bullish thesis more probable.

The question I pondered is, is there anything in the price action horizon that could take this market higher?

The answer is maybe yes but to me the April high is still absolutely critical.

The reason for this in my mind is because, we have seen this bullish flag pattern before. Everyone is calling this a pennant, or bull flag only to see the bottom eventually fall out. So for the bulls to have any case what so ever, they need to break this pattern of failed bull flags.
To do so, they not only need to break above the pennant, but hold it on any attempted bull trap. Doing so, would then outline a path to test the April highs.


I also want to outline the fact that a failed H&S top can very often turn into the handle of a cup/handle. One of the most relevant examples I can think of is the 2010 topping pattern on the weekly chart of the SPX.
Notice how we had a clean topping pattern in place only to have a failed breakdown, the neckline established itself as support again and away we went.


So here is what that would look like today. History doesn’t necessarily repeat itself, but a H&S failed breakdown, can be epic, so keep that in mind.


Now that we have sort of the bigger picture in mind, let’s lower the time frame and look to see a way the bulls could make this happen. The first step (outlined here blue), is to trigger and complete this little inverse H&S. Basically take a path similar to the green.
Doing so gives us a technical target of 2090.79.

Completing that pattern would be a huge win for the bulls. It would also trigger a much larger double bottom pattern with an upside target of 2127. What the bears want to do is prove to us this was an OPEX related rally and roll this thing over right here and take us back below Thursday’s low.


THE BOTTOM LINE:

People like to make technical analysis so complicated. We can simplify it by using patterns and price action. I have laid out a case here to take us much higher, and reduced it down to a much lower time frame to show you how that rally, if it going to happen is likely to occur.
Let me close by making it real simple. The key for the bulls right here is that any further weakness MUST hold above Thursday’s low of 2025.91.
If the bulls can take out Friday’s high 2055.48 it triggers the bullish pattern targeting 2090.79. Focus first and foremost on this tiny scenario as neither new highs or new lows occur until someone wins this battle right here in front of us.
As always follow my daily posting by joining the mailing list and I will  do my best to keep you in the know.

Comments »

“IF” the Semis can go into Beast Mode, they could lead this Market to New Highs.

As many of us know, the semi-conductor space is a risk on sector and when it makes a big move, it garners a ton of attention. So after Friday’s 3% move higher, a follower reached out and asked me my opinion on the Semi-Conductor Sector. So here are my thoughts.

The first place I like to start is with the question: Was there any price action that would have clued me in to such a rally? This is for my own chart memory, so that I can continue to pick up patterns and store them in my very deep pattern memory within my born to trade brain.

If we look at SOXX on the 30 minute time frame, we can see that Friday, it gaped above an inverse H&S. That target is 90.86 which coincides with the 76.8 fib retrace.
So that area may become resistance.  It is not a fib that gets much attention, but it usually a last stop for me. in selling a rip or buying a dip. If a stock can clear it, I start to give it the benefit of the doubt that it may indeed breakout and that selling into resistance may not be the best idea. (This holds true for a pullback into it as support as well, when it breaks it, most of the time, it takes out the low.)


The big picture is very much worth watching though as it may have implications for the market overall. The reality is there is a brick wall of resistance ahead, so we must be very aware of that. It is probably a better strategy if bullish to wait for levels that are resistance to start showing as support as right now, although it is trying to look healthier, still has it’s work cut out for it.

  • To start, we are in a 21 point trading range, with the potential of a double bottom cup/handle type patter to potentially break out of. That is bullish if it can indeed do so.
  • After looking like it was going to have a failed breakout, the bulls defended the down trend line and we are now back above it, with a significant gap and go.
  • Now we must  watch for the April highs to become support rather than resistance as a next step (i.e be careful chasing a breakout with the 94 resistance just above.)
  • Then see if it can take out the prior swing highs at 94.
  • If it can do that, that would give it a nice chance for a run up to the 2015 highs at 102.
  • If we can clear that overhead supply that opens the door for a move to the 114.98 measured move target.

So yes, many ifs to be answered but step one is to hold above that trend-line which so far it is doing. This is an overall win for the bulls for sure.


DOWNSIDE RISK

Of course if you are bearish on this market you believe the resistance holds firm. If so and we break down below the range, we have a target down in the 50s.

I don’t know what will happen, but these are the things I will be watching for in this sector and trying to place my risk reward plays accordingly.

Comments »

A Broad Technical Take on the Markets: Things Continue to Deteriorate

WEEKEND JOURNAL
Saturday May 14, 2016

(Everything here is opinion, not fact. It is not a recommendation to buy or sell any security. Do your own due diligence; this is mine, I am just sharing.)


Weekly Summary:


  • Market gets the oversold bounce we expected as double bottom acquires it’s target. 
  • Market now setup for further downside. 

In my last post here on ibankcoin,  at the end of Q1, the market was slowly grinding into it’s double bottom upside target of 2084. We thought there was little reason at that point to think that technical target would not get acquired and it ultimately did. The market ultimately hit it’s highs on 420 (ponder that for a moment).

The landscape has changed. For those of you that don’t follow me daily, you know we are now creating the 3rd consecutive and now much larger topping pattern that has this market setup for further downside.

A good time to take profits in what appears to be a major trend change setting up is as soon as CNBC run’s their “Markets in Turmoil”  special, which successfully called the last two swing bottoms. They ran the first one on 8/21/2015 and we bottomed on 8/25/2016 (2 days later)

and a 2nd one on 2/9/2016, and we bottomed 2/11/2016 (again 2 days later). Why people watch that garbage is amazing to me. Watch the price action and tune out the noise. I’m sure now all the current focus is when we are going to make new highs. Well not for a while and here is why. 

Chart here shows the two CNBC market in turmoil specials.

Coming into the week, we had acquired our initial downside targets on all of the major indexes and regular followers know I said to be ready for the bounce off of those targets to continue as the markets (at least from a stochastics perspective) were oversold.

I posted this chart (1st chart, below) and said “I expect a move back above Monday’s highs, as this will allow the algos to take out all the shorts who have stops up there, and that’s how the game is played“.

On the chart I said. “Gun to my head, algos trigger all stops and take us to 2084-2085” (see 2nd chart below)

If you guys have any doubt now that I have a feel for price action, you might as well stop reading here and go back and watch CNBC, who is actually very good at calling market tops and bottoms, they just have a funny way of presenting it.

The market is in turmoil folks.  All major indexes have more or less completed or triggered H&S topping patterns on the hourly charts. And if you are getting the nightly reports, while we watched the potential bullish pattern in the S&P 500 right shoulder, as I was tweeting Friday, taking out Thursday’s low was a major line in the sand, which broke. It does not mean we can’t see some more chop in this 2084 – 2050 area next week, if they decide they want to hold it up through OPEX, but I will be very very comfortable selling any strength now. That will be my plan if they try to hold this up, use strength to build a bigger short position.

THE S&P 500 – 
H&S top target is 1967.85 (we will re-evaluate there)
As you know I like to have a place where we might consider ourselves wrong or at least become more neutral. I would start to consider the bearish thesis under attack if we can regain the downtrend, and then last weeks highs.
In order to do that I believe we would begin to see some sort of higher low on the lower time frames to warn us. I see no evidence of that right now. Quite the contrary as the potential bullish pattern we were watching has all but been killed off. So yes, I always go with the price action if it changes (as you know), but zero on the radar right here. That will remain true for the other indexes which will discuss now.


The Russell
– Clean topping pattern which triggered, but needs downside follow through to totally confirm. A gap down would be nice. Downside target 1047.07 (re-evaluate there)

DJIA  – H&S top (triggered) target 17000.33 ( re-evaluate there)

NASDAQ COMPOSITE –  H&S top (triggered) target 4501.00 ( re-evaluate there)


Long Term Picture:
 

I don’t like the big picture here at all. Last week we made these points.

“Even if you have the view that this is only a trading range
1) we came to within 30 points from the top of the range
2) We have currently made a lower high here in April after making a lower low in Feb
3) Have a very similar topping candle to the one we saw in Early November
4) Have price action setting up for at the very least a 4% move lower 

Is this the place you want to be pressing longs? “

This week things have deteriorated even more. We have very clean shorter term topping patterns (as we discussed above) on the lower time frames, suggesting that the additional 3-5% is likely depending on the index. But there is little reason to believe we won’t at least test the Feb lows. Particularly as triggering these new patterns becomes the 3rd bearish pattern in sequence, since we acquired the double bottom target at 2084. Usually if it’s just a minor pullback, the 3rd does not complete or even trigger so if they do, and I see no evidence at this point they won’t and can start the momo trade lower again. Just like we saw in August and Jan.

Here is a look at the SPX weekly. Notice the long wicked candles at the top and bottom of all major swings. Is this the place you want to be pressing longs? 

This chart is best articulated on the NASDAQ, we are in a down trend. Lower Highs and Lower Lows is a down trend.  Is this the place you want to be pressing longs?

The R2K – Failed right at the 61.8 Fib from Jun 2015 High to Feb 2016 Lows.

a. The 12 Month moving Avg : Holding above it by a thread. But it is still declining.

b. The 10/20 Month Moving Average Crossover :
Ignoring price for a minute put this in perspective using these long term moving averages.

Breadth

Continues to deteriorate. Last week we had 61% of stocks above the 40 DMA. We are now at 52% Middle of the range, oversold is a long way away.


The Bottom Line:
Things continued to deteriorate this week and we have nice side topping patterns in place to watch for trigger or further follow through. This is our number one priority. We want to see if the bears can maintain control or of the bulls can build some sort of reversal right here at support or just below it. There is nothing in the works just yet, but we must keep an open mind just in case. I am short and will remain that way until I see price action evidence to change my mind. There is none yet.  As always follow my thoughts intraday and on the nightly report. If you think this will be interesting to others, please do share and have them join my mailing list. Thanks and happy trading.
 

This Week’s Chart’s in Focus:

Let’s review a few charts that I consider worthy of your attention:

Comparison: The last few days of this week we were watching that inverse H&S pattern in the SPX. I was noting that the R2k did not have that pattern at all and that I thought that the SPX pattern would ultimately fail. It is also something that is common. The one that is freshest in my head is OMER which is showing a major top on the weekly time frame. You notice how it too at one point had a bullish reversal pattern in the right shoulder. This is now back at the neckline and will likely break down. This is just for comparison as it demonstrates how not only do these patterns exist on all time frames, but that we typically like to give the benefit to the bigger pattern at least until the smaller pattern can at the very least trigger. What I was doing this weak was selling strength, knowing that my risk was the breakout of the bullish pattern, which I thought was very unlikely although I would let the market decide.  I thought it is something to bring to your attention, as one of my followers found it interesting and helpful when I posted on Friday afternoon. The SPX did ultimately break down and is now sitting on the neckline as we showed at the beginning of the report.

Transports (IYT): This was in our report last week as well. This triggered the double top pattern and the downside target is 127.13. Needs follow through, but a feather in the bear cap.

Yen: After acquiring it’s inverse H&S target at 92.88, it retreated and has now formed and triggered a Cup/Handle setup targeting 106.31. Still in this channel, as long as it stays in that uptrend, not good for equity.

DBA->Agricultural ETF Sitting right on the inverse H&S neckline. I am long this, my stop would be a close below the 200DMA.

AAPL-> If you are short this one, I still think 80 is a good target and place to take profits. That represents the H& measured move as well as the 161.8 fib from the recent up move well documented in these blog posts 

Comments »

Another Quarter and More Central Planners to the Rescue

A very brief introduction as this is my first post for the Peanut Gallery. I am a technical trader and I Journal like a mad man as it helps me think through my trades. Like many I take a very top down approach to the market and study the price action primarily in the S&P and Russell to gauge the amount of risk I should be taking. Here I will share some of the things (hopefully each week) that catch my eye or that I am paying attention to. I hope you find my contribution useful. Below are my current thoughts on the markets.

WEEKEND JOURNAL NOTES
Sunday April 3, 2016


Another week another month, another quarter and another central banker saves the day. What else can we say?  Whenever there is bearish looking price action on the tape, the central planners come in with some sort of dovish talk or bazooka type money printing and the market doesn’t just bounce but causes an epic short squeeze followed by epic FOMO (Fear of Missing Out). Don’t fight the fed the saying goes and this is a perfect example of why. Will this ultimately end badly? Probably, but until we have bearish price action to work with, what else can we do but protect our longs by raising stops and ride it? 
Especially after one of the most unprecedented quarterly candles any of us have ever seen. 

Let’s take a weekly look at the markets staring with the S&P 500.

 
At this point in time it looks as though the S&P is going to acquire it’s full double bottom target at 2084.30 (calculation shown on chart)  as there is barely a glimmer of bearish price action to work with and as we saw Friday, any kind of dip is bought with both fists. Fighting that just seems stupid. Every bit of me wants to short the (insert word here) out of this market, but the opportunity is yet to present itself.
There are a couple of items however, that I think are very important for us to watch this week.

1) The S&P 500 is ~12 points from not only a major technical target (2084.30) but also this descending trendline, which would protect a prior swing high and leave the longer bearish macro picture in place for the forseeable future. This is a huge area up here in my opinion.
2) I am seeing the first signs of bearish divergence between price and momentum. This can last a while so just seeing that is no reason to short, but it is something I like to make note of particularly when in a position of protecting remaining longs in this rally.

3) This breadth indicator which I monitor closely, caught my eye as I see the possibility of a repeating pattern here in the % of stocks above their 40DMA. Not only do we have a massive divergence in the RSI, but we have this little rising flag, which had the same type of price action in the last two major market moves lower. I will be keeping my eyes on this this week.

Is this breadth indicator flashing a warning?


The Russell 2k:

In the Russel many including myself were thinking we were seeing a mini H&S in the Russel last week, which like the one we saw in the S&P was shut down hard by the dovish speech by Yellen. 

However on the bigger picture we still have a lower high despite the big rally so it will be interesting to see if the Russel can continue to build on this move or if it is forming a Bearish right shoulder.

The VIX continues to hug this lower Bollinger Band (20,2)  as it approaches it’s lowest level since October.


For Long Term Investors: 

I like to keep an eye on 2 things. 

The 12 Month moving Avg : now flattish, and we are hovering above. I will see if this can prove as support on a pullback. 

10/20 Month MA Crossover Watch: The 10 remains below the 20, but price is back above. So using this as an indicator in the way we have been thinking really seems irrelevant now as central bankers continue to hurt any sign of bearish price action. 


The Bottom Line:
The S&P 500 is very close to not only acquiring a major upside technical target but also approaching trend resistance with what looks like momentum divergence. Additionally volatility is hovering and continues to press on the lower Bollinger bands near the October lows. One would think that if the bears are going to have any chance things would start to materialize soon. This may mean a month of range like chop like we saw at the end of 2015 before our next big directional move.


Chart’s in Focus:

(XLE): There is no secret that the rally in oil names helped this rally get started and added to it’s strength as it continued. However below both the declining trendline and the declining 200DMA, we are seeing a bearish H&S pattern. Whether this has market implications or not, it certainly has implications for this sector. There are many names in this sector that look extremely vulnerable from my chart reviews so it is worth your time if you are looking for potential short setups.

Biotech (XBI): Has been a complete and utter disaster since last summer but showed some rotation last week. In my mind, this is still a reapeat of what we saw at the end of last year until we can get back above that prior swing high at 54.71 on a closing basis. I become far more interested then.

Apple (AAPL)
I was bullish on AAPL from about 97 and took profits at 105 and have been neutral since. In my mind it (like XLE) is that the 3 lines of bearish defense that I would be very aware of if I were long
1) Descending Trendline
2) Declining 200DMA
3) 61.8 Fib

Comments »