iBankCoin
Home / Gio (page 63)

Gio

This tape is out of my league

I am certain I am not good enough to trade the remaining of the year. With volume this light, and the Vix this “low”/inactive I feel like I am…

Trying to take on Kimbo Slice for a short pass…

Or like Steve Nash trying to take a charge…

Or like a skater with nothing to protect the boys…

Or like Danley putting both eyes on the ball, and not on the Dumas…

Or like a college kid who hasn’t had enough sleep before an exam…

Or like Max and not Kevin…

… point is, don’t bet on the market when you just can’t win.  Don’t let the market KO you in the final round when you already have enough points to win the fight.  Or, another way I like to put it… “don’t let the dumb money outsmart you.”

-gio-

Comments »

If you like IBD, you’ll like the PPT

I’ve been messing around with The PPT screener tools and Fly’s proprietary delta hybrid scores to find anything interesting going on in the market.  As you know, I’m a big fan of IBD- subscribe and read daily, trade in and out the IBD 100 etc.  …anyway, as an IBD user, using The PPT comes a little naturally to me.  I’ll discuss more of this later, but just know that while the IBD 100 is used as a tool for finding CANSLIM worthy stocks, The PPT if used correctly can be used as a tool to track momentum stocks that can turn into CANSLIM worthy stocks.  For example, while the IBD 100 stresses earnings, insider ownership and technicals on a weekly basis, I have found The PPT to almost do the same thing but on a daily basis using the Delta Hybrid (daily and weekly) columns.  It’s pretty cool.  I have yet to do this study, but I have a theory that if I track the IBD100 using Delta Hybrid for each stock, I can predict whether an IBD100 stock will move up or down the list.  Truly, under the hood of the Fly’s time machine is The PPT.


Take a look at some of these stocks The PPT screened for.  Some which intersect with Investors Business Daily.  I’ve been tracking some of these in search for leadership, but I still feel it is a little irresponsible for me to recommend swing longs while in a bear market (note:  currently, our low volume sell-offs are, get ready… bullish).  Here’s some stocks to look at:

This stock completely ignored the market’s meltdown in October.  Amazing!  Now if only it would pullback on light volume, then we could get one fo those IBD-like entry points…

This one already is on the IBD100, and it’s the #1 stock on The PPT‘s Hybrid Score… 


I wish the chart showed the volume a little better, but if you look close enough, you’ll notice The PPT caught a nice breakout.  Again, this is in The PPT‘s top 10 technicals.  Breakouts have been very rare in this current market.

Another stock that still thinks we are in early 2007.  I miss these charts, don’t you?…

And just like the IBD100, I like to use The PPT to search for “strong stocks” that are showing signs of a breakdown.  Then I can create a strategy to short it.  That’s basically where I got my training for becoming a contrarian trader- shorting the hype and greed in Elliot’s cycle.  This particular stock I am planning on buying longterm puts as a hedge against a total market meltdown….


If you have any questions about Investors Business Daily, or The PPT feel free to email me.

-gio-

[email protected]

Comments »

Shorting in VIX 40s = success, despite its search for a bottom. yeah, I’m scratching my head a little. Tags for $EDU, $MELI, $DRYS


I guess all that matters is that it worked.  Market down -200 at one point today.  (had to change that. Lol.)

First of, let me say that the Vix is still falling even though the market is falling (what the?).  I can only attribute this to three events:

1)  The rate cut to zero, which is causing a lot of short term confidence (relief from fear, hence dropping VIX)

2)  Quadruple witching’s re-setting of options.

3)  Low volume holiday trading (we have a shortened week)

… what you need to understand is that the VIX is searching for a new range to trade in.  Since greed/fear is dynamic with news and deteriorates with memory, you have to keep re-setting your VIX ranges.  I think between October to November that range was something like 50-80.

So, despite the Vix’s trickery (falling while market falls), it turns out that selling longs at Vix low 50s, and shorting in the Vix 40s (spikes down, if you can find them) turned out to work quite well.  I excuted three shorts that worked really well on this higher probability setup.  Don’t get me wrong though, I am keeping a list of leaders that have been moving up under the market’s radar, and if they pullback on low volume then as a loose CANSLIM rule, you would want to buy those.  Anyway, here are the three shorts I took up matched with the spots on the VIX that triggered my entry.  I closed DRYS for a 22% gain and MELI for a 12% gain, still holding EDU short:

A nice breakdown in a momentum stock (DRYS).  I did a few intraday shorts in this too, and since the momentum fades worked intraday, I knew it would work for multi-days.  Shorted Thursday.


MELI was one of those ugly stocks that went up like a billion % in the past few weeks.  Shorted it on a VIX spike down instead of chasing this.  A nice high probability setup.


And EDU, which I forgot why I shorted it. Lol.


So anyway, as you can see on today’s tape, so far it looks like the Fed’s Rate-Cut Rally is completely wiped out.  That usually happens if you understand what “sell-on-the-news” means.  And finally, the Vix remains a little elusive here.  I have yet to figure out a new range that will give me higher probability short and long entry points.  My guess is 37-57, but it probably will be tighter as we head into 2009’s lame duck period (I would not want to be heavily short going into Bush’s exit).

Well, it was cool to surf two 10-footers (DRYS and MELI).  Time to go watch the real surfers pound ’em over at Bonzai Pipeline!

Comments »

ARTC down -63% to an all time low! … congrats to “Ass” Mike for banking $30k this trade!

Chart for ArthroCare Corporation (ARTC)

ArthroCare got horse nuked today after the CFO resigned from accounting issues. Hey wait a minute, didn’t I had this company on my rumors watch with pending FB investigation (it’s on the right sidebar of this blog if you haven’t noticed yet)?

Wow! Lol. I guess my sidebar is worth something…

Never invest in a company that’s getting investigated by the FBI. I actually thought ARTC would come crashing down next year, but I should have known the men on the Board of Directors would start exiting before years end!

Update:

Glad to see one my readers profit from some of my calls, even if he may be an “ass”…

… see! Even a Boston fan can make money.

Check back for the status on Mike’s altruism.

Comments »

Finding an Entry Point in a Deteriorating Inverse ETF (Tags for SRS, SKF, FXP, EEV)

http://www.lysator.liu.se/~calle/gif/catbert.gif

Do you know what an ETF is? Ha! We probably just trade them just to trade them. The easiest way to describe it is it’s like a stock-mutual fund.

If you’ve been trading ETFs, and iETFs (inverse), then you know that they are influenced by market forces. Well, you probably didn’t realize just how strong this force was. In other words, many of these highly liquid ETFs (especially the 2x), like SRS SKF FXP EEV, can quickly trade at a huge, and I mean huge huge huge premium or discount. For that reason I’ve been saying the 2x ETFs were becoming a good contrarian indicator, much like the put/call ratio (currently we are trading at a discount).

So how can we find an entry point in an ETF like the aforementioned, when it seems like they’re so cheap? Well, because a lot of the index 2x and 3x ETFs are very forward looking and emulate the properties of contrarian indicators, I find these ETFs trade best when there is a lot of volatility in the market. So, check the volatility!

Ask yourself: How does the market’s volume and direction affect an ETF like SRS, SKF, FXP, EEV?

…Understand that these ETFs are deteriorating, or like gravity, just have a tendency to go down. So, if there’s not enough volume in the market, then you will see an invETF like FXP or SKF just melt down. If the general market is trending up, the deterioration in price will be accelerated.

Ask yourself: How does volatility affect these invETFs like FXP or SKF?

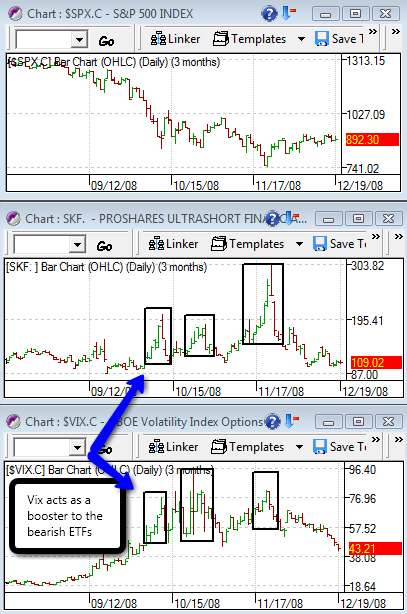
…They affect them drastically! The higher the volatility, the less deterioration/gravity effect on them. Usually when volatility is high, these instruments become easier to trade over longer periods. Therefore, it is important, at least for me, for the VIX to be in firecracker mode. Notice from these 3 charts, that the Vix actually acts as a booster for the invETFs. This theory sounds reasonable because the invETFs are acting a lot like contrarian tool- we tend to overshoot the market when it comes to fear. More importantly, notice when the Vix reverses, these invETFs drop, as if the floor were just removed from under it. For this reason, I prefer to short SKF rather than get long UYG in the event of a relief rally.

Pretty amazing stuff there going on. Another thing you may want to consider is to short the invETFs on the first sign of a Vix reversal/fear reversal if you’re holding shorts. I mentioned earlier when SKF was above 300, and the Vix was above 80 that you should buy some December puts. Those would have been incredible hedges!

In hindsight, I noticed a lot of people were buying up stuff like FXP, EEV, and SKF since late November, thinking they were getting a bargain on them, but were actually buying knives. Remember, since late November, the market’s personality drastically changed as the Vix lost a lot of strength, which translated to less interest in the bearish ETFs. And, because they are strongly dictated by market forces (demand/supply), they just kept on falling.

So try to stay away from going long these inverse ETFs, 2x, 3x, 5x, 10000x, when the market is “quiet.” If you want to maximize your gains on them, use the VIX to amplify the price. Remember, they are driven by market forces. Occasionally you will get some life in the Vix intraday, and when that happens I like to short or get long these “badly priced” deteriorating ETFs.

One last note- I have a feeling the entire ETF market is turning into a bubble, and that they are destroying our market. Remember, these instruments are deteriorating… One day they will all just be another mutual fund. We have yet to see the damage that these ETFs will do to the market and to itself.

-gio-

Comments »

Alternatives to Sex During a Recession

This is in response to WoodShedder’s post. His last title to his post completely captured my attention. How dare him! Well, since sex sells, I decided to take the same approach and use “sex” in my title to draw more readers. Looks like it worked because you are reading this. Fine. Answer this poll so Woodshedder can tell us if we should short MCD or get long PLA (pun not intended. I promise!):

Tomorrow, expect nonsense. I really don’t like trading during options expiration days. Since so many have asked me what will happen on quadruple witching day, I decided to dig up our last one on September 19th, and a few others. Pay attention to price and volume.

As you can see, volume really did spike in anticipation of quadruple witching for September. Actually, some crazy stuff was going on there. The market dropped -400 points, then rallied almost 800 points until quadruple witching day all in the week… Look at the tape action from the 16th-22th strange space alien action! However, this really did set up for one bearish October! …

PRICES

Date Open High Low Close Volume Adj Close*
30-Sep-08 10,371.58 10,922.03 10,371.58 10,850.66 6,065,000,000 10,850.66
29-Sep-08 11,139.62 11,139.62 10,266.76 10,365.45 7,305,060,000 10,365.45
26-Sep-08 11,019.04 11,218.48 10,781.37 11,143.13 5,383,610,000 11,143.13
25-Sep-08 10,827.17 11,206.05 10,799.77 11,022.06 5,877,640,000 11,022.06
24-Sep-08 10,850.02 11,041.02 10,696.38 10,825.17 4,820,360,000 10,825.17
23-Sep-08 11,015.69 11,214.65 10,763.77 10,854.17 5,185,730,000 10,854.17
22-Sep-08 11,394.42 11,450.81 10,956.43 11,015.69 5,368,130,000 11,015.69
19-Sep-08 11,027.51 11,415.48 11,027.51 11,388.44 9,387,169,600 11,388.44
18-Sep-08 10,609.01 11,149.07 10,403.75 11,019.69 10,082,689,600 11,019.69
17-Sep-08 11,056.58 11,068.87 10,521.81 10,609.66 9,431,870,400 10,609.66
16-Sep-08 10,905.62 11,193.12 10,604.70 11,059.02 9,459,830,400 11,059.02
15-Sep-08 11,416.37 11,416.37 10,849.85 10,917.51 8,279,510,400 10,917.51
12-Sep-08 11,429.32 11,532.72 11,191.08 11,421.99 6,273,260,000 11,421.99
11-Sep-08 11,264.44 11,461.15 11,018.72 11,433.71 6,869,249,600 11,433.71
10-Sep-08 11,233.91 11,453.50 11,135.64 11,268.92 6,543,440,000 11,268.92

And here’s the price action of quadruple witching for March (nothing significant happened on June’s quadruple witching). This one had bullish action going on the tape. Anticipation of quadruple witching moved the market up about 500 points, which ignited a long Sisyphean rally all the way to May. Notice, however the massive volume drop on the 19th, then a huge influx of volume returning on quadruple witching…

PRICES

Date Open High Low Close Volume Adj Close*
28-Mar-08 12,303.92 12,441.67 12,164.22 12,216.40 3,686,980,000 12,216.40
27-Mar-08 12,421.88 12,528.13 12,264.76 12,302.46 4,037,930,000 12,302.46
26-Mar-08 12,531.79 12,531.79 12,309.62 12,422.86 4,055,670,000 12,422.86
25-Mar-08 12,547.34 12,639.82 12,397.62 12,532.60 4,145,120,000 12,532.60
24-Mar-08 12,361.97 12,687.61 12,346.17 12,548.64 4,499,000,000 12,548.64
20-Mar-08 12,102.43 12,434.34 12,024.68 12,361.32 6,145,220,000 12,361.32
19-Mar-08 12,391.52 12,525.19 12,077.27 12,099.66 1,203,830,000 12,099.66
18-Mar-08 11,975.92 12,411.63 11,975.92 12,392.66 5,335,630,000 12,392.66
17-Mar-08 11,946.45 12,119.69 11,650.44 11,972.25 5,683,010,000 11,972.25
14-Mar-08 12,146.39 12,249.86 11,781.43 11,951.09 5,153,780,000 11,951.09
13-Mar-08 12,096.49 12,242.29 11,832.88 12,145.74 5,073,360,000 12,145.74
12-Mar-08 12,148.61 12,360.58 12,037.79 12,110.24 4,414,280,000 12,110.24
11-Mar-08 11,741.33 12,205.98 11,741.33 12,156.81 5,109,080,000 12,156.81
10-Mar-08 11,893.04 11,993.75 11,691.47 11,740.15 4,261,240,000 11,740.15

Now here is how we are looking heading into December‘s quadruple witching…

PRICES

Date Open High Low Close Volume Adj Close*
18-Dec-08 8,823.94 8,946.36 8,516.02 8,604.99 5,675,000,000 8,604.99
17-Dec-08 8,921.91 9,001.96 8,701.13 8,824.34 5,907,380,000 8,824.34
16-Dec-08 8,565.65 8,985.63 8,534.03 8,924.14 6,009,780,000 8,924.14
15-Dec-08 8,628.81 8,738.40 8,431.04 8,564.53 4,982,390,000 8,564.53
12-Dec-08 8,563.10 8,705.43 8,272.22 8,629.68 5,959,590,000 8,629.68
11-Dec-08 8,750.13 8,861.86 8,480.18 8,565.09 5,513,840,000 8,565.09
10-Dec-08 8,693.00 8,942.46 8,589.86 8,761.42 5,942,130,000 8,761.42

Looks like most of the space alien magic occurred before the Fed rate cut, then after. We actually dropped on lower volume yesterday, so if history repeats, then we should have an up day tomorrow… but you know me by now, I believe there’s too many variables out there for history to repeat itself… we only highlight the histories that happen to repeat itself.

So basically, what will happen tomorrow… flip a quarter. Just know, the next time we get options expiration week, try to exit as many swing positions as you can. I’m sure a lot of people got whipsawed this past week, and many of them are great traders, doing everything right, except these special weeks don’t care about what’s “right.” (For a day trade I only have 3 setups. One of them is to short SRS in an event the market moves higher. End that party.)

Well, hope that sheds a little more light, or maybe it’s blocking the light. Whatever.

As we turn into the final week of December, I hope to “re-set” my Vix charts. In other words, I’m throwing out all previous “short the market points” and “buy the market points”, simply because fear and greed are dynamic. I’ll let you know later. I always start of with a number of combinations, then throw some out as time goes on. For now, it looks like the Vix is drifting, searching for another channel to chill inside. That means we’ll probably be range-bound in the markets for longer than we think. It might get boring for a while. Until the Vix comes back to full force and we get a trend that actually doesn’t screw up on volume, keep your positions light and don’t be afraid to take a profit. We’re range-bound! You’ll have plenty opportunities to re-enter. But please, enough of this market down -200 points Vix down -2% nonsense!

—————–

Finally, on Thursday, I put in this day-trade. Notice the short-covering that moved DRYS up, that led to synchronized selling with the overall market when Vix bounced off 44.xx. That was a great place to short (I shorted a number of other retail stocks, long iETFs, but exited about half at the close)!

Have a great weekend! Whatever you answered in the poll will determine the kind of weekend you will have. Enjoy the food!

Comments »