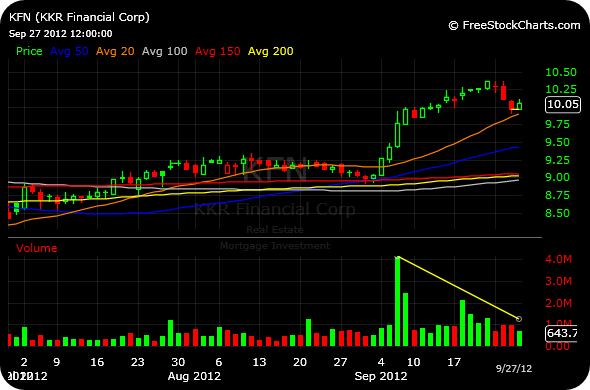
The two daily charts below of H and KFN serve as examples of the type of technical setups you look for during a pullback from multi-year highs in the market, without signs of a major top at hand. Note the constructive overall volume patterns below, with the green bars denoting buy volume overpowering the red selling volume bars. Next, note that both stocks pulled back to their respective rising 20 day moving averages amidst an uptick in negative sentiment accompanying the market correction.
Moving averages are best used as reference points to gauge the underlying strength of a security or index, or lack thereof. While there is always the possibility of a vicious bull trap (which is why stop-losses are always a recommended strategy), the bulls got the reaction they wanted by the market on Thursday with a bevy of bounces off 20 day moving averages like the ones below, with sound volume patterns intact.
____________________________
____________________________