
They’re all acting like Berkshire today, at least most are. Check out one of The PPT ‘s hottest industry’s today. Kick on image for full size.

They’re all acting like Berkshire today, at least most are. Check out one of The PPT ‘s hottest industry’s today. Kick on image for full size.

Although 2013 is still very young, oil well services and equipment stocks are up over twice as much as the S&P 500 Index, year-to-date. The first chart below is of the sector ETF on the weekly timeframe. Note that $45 still needs to be breached to likely set in motion a sustained breakout. However, underneath the surface I am seeing very strong action with sound buy volume to have me looking for follow-through in the coming weeks, beyond the ubiquitous oil service stocks BHI HAL SLB, etc.
In addition to the weekly charts of four individual ideas below (I believe the weekly timeframes offer the best perspective here, especially in the face of a pullback or pause this week), members of The PPT and 12631 can click here for my “12631 TOP ENERGY PERFORMERS” saved screen.
_______________________________________

_______________________________________

_______________________________________

_______________________________________

_______________________________________

Last night, I made the following video for 12631 subscribers walking them through the resurgent regional bank sector. I also guided members through using The PPT screener to better isolate trading ideas.
Comments »
NOTE: chessNwine’s Weekly Strategy Session has been published and sent out to members this week. I am confident that you will find this week’s version to be of tremendous value in your weekly preparations for the market. It is never too late to sign up at a very reasonable price, so please click here for more details about subscribing or even making a one-time purchase (the subscription plans offer much better value over time). As a reminder, members of 12631 receive the Weekly Strategy Session at no additional cost, as it is included in their membership.
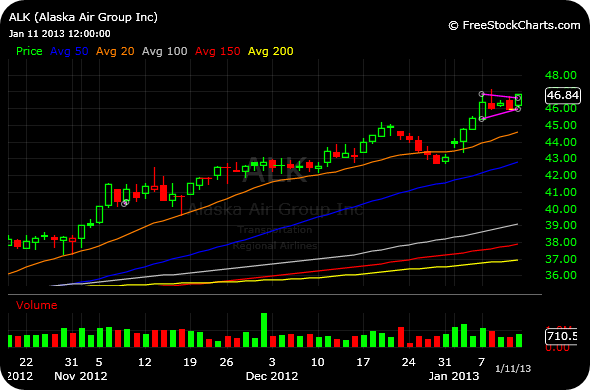
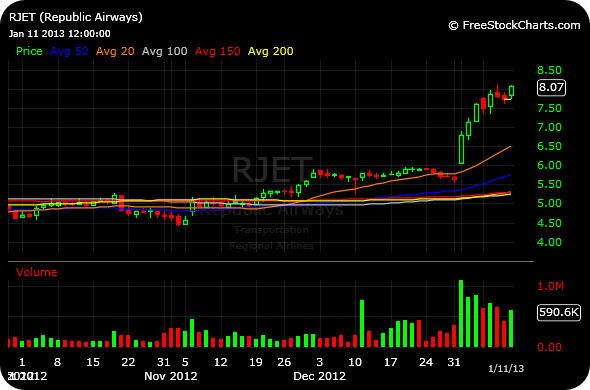
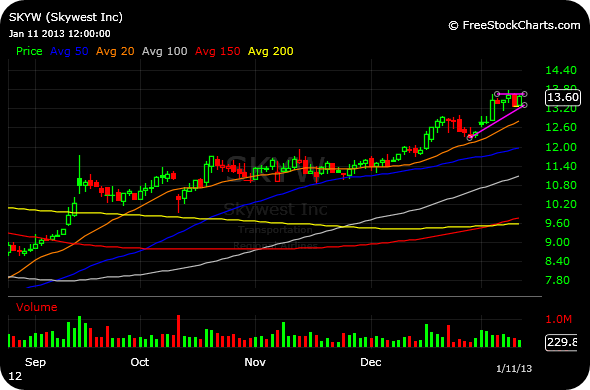
Many regional airlines are popping up with some enticing technical setups here. We all know the major carriers like DAL and LCC have had a strong run of late, but falling asleep on the regionals might be a missed opportunity. The bears have been suffering motion sickness up in the air lately.
Members of 12631 and The PPT can click here for the full list of regionals, sorted by Friday’s daily hybrid moves.
_______________________________
_______________________________
_______________________________
For more details about joining The PPT and 12631, please click on those respective hyperlinks.
Comments »
{Friendly Reminder–Please be sure to download our iBankCoin App here)
On Tuesday, I bought a starter swing long position in Medifast at $30.46 inside 12631, with the intention of adding on strength. In addition to the daily chart acting very well throughout 2012, but especially outperforming the market in recent months, the weight management firm is headed into a very seasonally strong few months (more on this later).
More importantly, though, the monthly chart of Medifast reversals a noteworthy configuration. The “Bullish Rising Three Methods” is a rare but extremely bullish pattern. It is a “five stick pattern,” meaning it takes five separate candlesticks to meet the elements of the pattern. Within the context of a prior uptrend on a given timeframe (here, monthly), we see a long green (or white, depending on your charting software) candle which obviously illustrates further strong bullish momentum, followed by three small red (or black) candles denoting consolidation. At that point, the bulls arrive impressively once again for another long green candle to exceed the highs from the prior long green candle.
In essence, the pattern denotes a textbook bullish, tight consolidation that confirms higher without any nonsense, or too much backing and filling beyond the three small red candlesticks. The three small red candles should stay within the price range of the first long green candle. Now, in this case with the Medifast monthly chart, we can see the first red candle does make a new high. However, it would be more of a problem is the lows of the first green candle were breached, rather than the highs. Furthermore, the gist of the pattern here is that the third and final red candle does not come close to penetrating most of the upside progress made by bulls during the first long green candle.
As such, I am playing Medifast under the thesis that the breakout on the daily chart is just getting started, and all-time highs will be exceeded in the coming weeks. Although my stop-loss will trigger well before it happens, a weekly close below $25 casts doubt on that thesis and the whole pattern in general. That said, the Bullish Rising Three Methods is rare, powerful, and should be respected.
Also, courtesy of The PPT, note the seasonality statistics for Medifast as we head into December and, of course, New Year’s resolution-ridden January. While far from a sure thing (the stock was down several times in December and January as well), when the stock was up, it was up big-time in those months. These data points add more substance to the Bullish Rising Three Methods into December and January.
Seasonality
| Month | Avg % Return | Total # Months | # Months UP | # Months DOWN |
|---|---|---|---|---|
| January | 12.407 | 19 | 9 (47.37%) | 10 (52.63%) |
| February | 6.588 | 19 | 10 (52.63%) | 9 (47.37%) |
| March | -0.125 | 18 | 8 (44.44%) | 10 (55.56%) |
| April | 4.238 | 17 | 9 (52.94%) | 8 (47.06%) |
| May | 7.354 | 18 | 7 (38.89%) | 11 (61.11%) |
| June | 2.153 | 17 | 6 (35.29%) | 11 (64.71%) |
| July | 14.227 | 19 | 11 (57.89%) | 8 (42.11%) |
| August | -3.858 | 19 | 7 (36.84%) | 12 (63.16%) |
| September | -2.44 | 18 | 6 (33.33%) | 12 (66.67%) |
| October | 7.743 | 19 | 10 (52.63%) | 9 (47.37%) |
| November | -0.047 | 19 | 7 (36.84%) | 12 (63.16%) |
| December | 3.768 | 16 | 7 (43.75%) | 9 (56.25%) |