
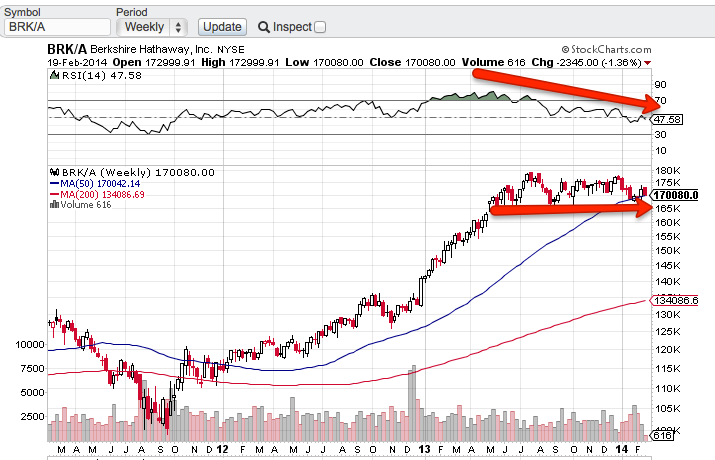
Berkshire Hathaway’s weekly chart has a declining RSI (top pane on first chart, below). However, price has yet to breakdown lower. If $166,000 is lost, I suspect the RSI divergence will begin to matter in a big way and Berkshire’s pullback will depend considerably.
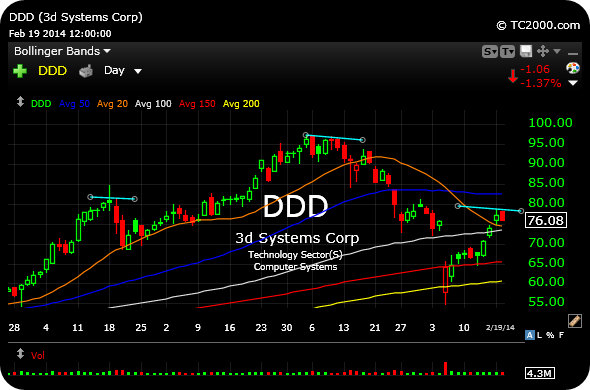
Also, note the DDD head and shoulders top on the daily chart, second chart, which I mentioned previously.
And a long idea if we see the market rally: INSY.
Which stocks are at the top of your watchlist this morning?
______________________________________________________________
______________________________________________________________


Still think SIFY looks interesting.
Awesome photo Chess! Where is that? Tuscany?
Believe so, Marc, thanks!