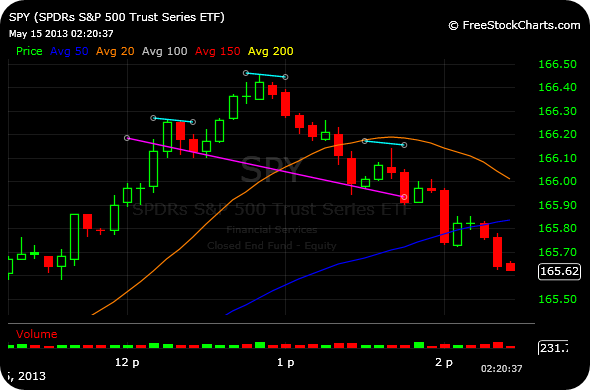
The first chart below is a 5-minute intraday SPY chart, which shows a head and shoulders topping pattern (on this very short-term timeframe!) putting pressure on the market this afternoon.
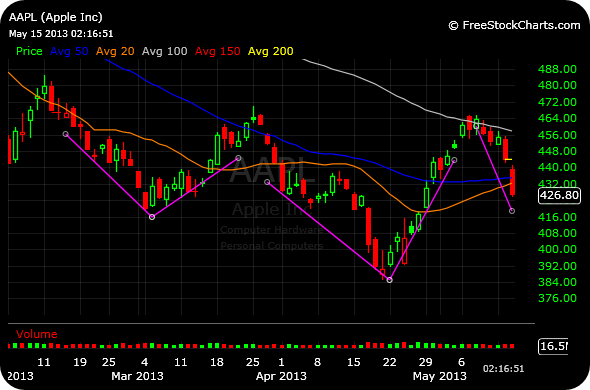
Next, to update my Apple analysis from yesterday. initial support at $434-$437 was not defended well by bulls. So now the $419 area appears to be in sight. As I noted yesterday, that would be the bulls’ best case for a massive inverse head and shoulders bottoming pattern. But they simply must defend it forcefully.
______________________________
______________________________