With sentiment towards the lagging semiconductors understandably very negative here, let’s take a look at bellwether Intel for clues as to whether the reflexive gagging going on towards the price weakness warrants turning bearish.
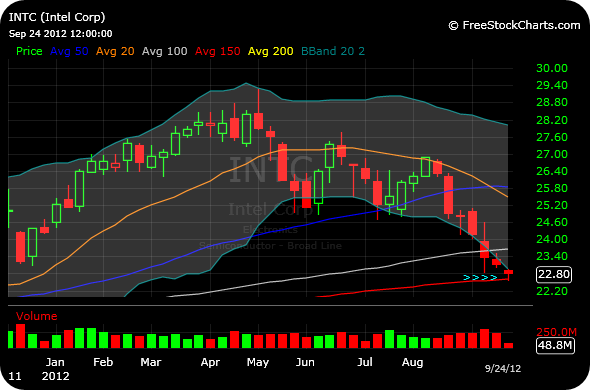
Clearly, Intel has been weak and lagging the broad market as well as many other Dow components since hitting eight-year highs back on May 2nd of this year. Indeed, the corrective downtrend has become rather pronounced as the summer progressed, particularly since mid-August.
On Monday, Intel printed what is known in Japanese candlestick theory as a “hammer” price candle for the day. As I have written many times over the years in this blog, only when used in the proper context, the hammer often signals a trend reversal. Above all else, the hammer (on a daily chart) shows that the price drops significantly from where it was at the opening bell, yet rallies back towards the end of the session up near the opening price level. Some key elements are: a prior bearish trend, little or no upper wick to the candle, and a small body at the top end of a long lower shadow.
Even when applied in the proper chart context, the hammer is not an automatic buy signal. It is, however, a reason to stalk for signs of a reversal in trend, particularly when we have seen a clear bout of prior selling. Moreover, even if the hammer is confirmed to the upside, it does not mean that the bottom is in forever. Instead, it is usually a sign of an intermediate-term tradable bottom.
Of course, the current market has been strong and the weakness in Intel and the semis could easily be the last holdout before they play catch-up higher into the end of year. Let me also be clear that I usually do not trade hammer setups, as I prefer to focus on the very best technical setups with stocks in established uptrends. Nonetheless, as a blogger I am apt to point out various types of setups and divergences to the conventional wisdom you might see on your Twitter stream.
Applied to Intel in the present, sentiment is rather fully bearish or dismissive of the action in the semiconductors. They, along with the transports, are being seen as the red-headed stepchildren of an otherwise solid market. Thus far, the semis and transports have not been able to bring down the rest of the market with them, indicating strong underlying demand for equities as a whole. Combining sentiment with Monday’s hammer in the proper context, I am on watch for upside confirmation in the coming days. A forceful close below $22.52 (the lows of Monday’s hammer) would likely invalidate the bullish reversal thesis.
Also note on the second chart below of the weekly timeframe that Intel opened this week with price entirely below its lower Bollinger Band. If you backtest, you will find that even during the 2007-2009 bear market Intel never had a full week of trading entirely below its lower Bollinger Band–Another signal to be reticent in piling on in terms of the current bearish sentiment regarding Intel and the semis.
___________________________________

___________________________________