Still Short / Sector Reversal Signals / Market’s Shooting Star

Today was the perfect example of a day where you had to stand firm if you were short. There was no reason to cover despite the market killing most of your gains. You must know that, statistically, only 1% of breakaway gaps fill within the first 5 days. We marched to the high of the first opening gap’s bar and quickly failed, unable to fill, unless you were the Nasdaq (COMP). Right now, it’s a fight for the 50-day MA for the SPX, DJIA, and RUT. The COMP formed a shooting star, a ‘warning from above’.


Yesterday’s action confirmed the breakaway gap in several sectors, most notably in energy, cons. staples, and industrials. Further, the cons. disc. and materials sectors formed a 2nd consecutive doji, signaling major indecision. Health care formed a black filled candle at it’s uppermost resistance and we can see shooting stars in tech and utilities. All are potential reversal patterns. The financial sector is actually the strongest sector, but I’m not concerned at this time.
I’m pleased to announce that iBankcoin has received $4.85 million, our first ever round of capital from our new partners in Washington, DC. They are also investors in my own hedge fund. I set up the meeting a few weeks ago and Fly closed the deal immediately yesterday evening. The negotiated proceeds will be used for future acquisitions, tech upgrades, advertising, and general operations. We are working on establishing new partnerships for the iBC brand and attract additional talented financial writers and trading professionals.
Comments »Financials Breakaway / Possible Inside Day & Continuation

The day’s actions were acceptable, but I would have liked to seen more neutral flagging. Neutral flagging is a continuation pattern for the down side. Pronounced sell-offs create reactionary rallies. The funny thing was that the day was actually half and half. It looks like we could have an inside day or a continuation of the sell-off. I am short like you wouldn’t believe, 25% of it from EOD Friday, and I refuse to cover because there is no reason to do so presently.


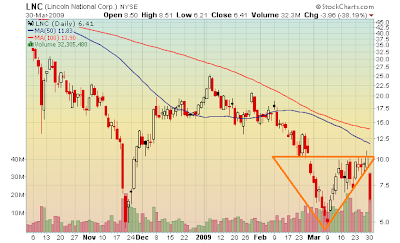
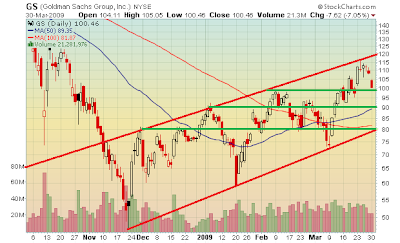
The financials, especially the insurers, are in a heap of pain and the breakaway is more pronounced in that sector more than any other sector (surprise!). The insurers, such as HIG, MET, LNC, PRU, and AFL most likely started a new leg down. BAC, WFC, JPM, C, PNC, COF, and STI have all broken down, forming major breakaway gaps.
Looking at the rally from the start, the uptrend of many sectors are still intact. The financials are once again dragging the market down. To get the biggest bang for your buck, it’s best to short the financials and not any other sector. However, don’t trade them if you can’t the volatility. The other sectors must follow the financials quickly for any meaningful decline to take place.
Comments »Shitting the Bed
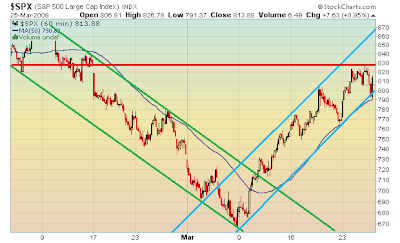
Looks like we will open right above the 50-day MA. Immediate support is at 791 SPX (50-day MA & Mar 25th pivot). If that breaks sometime, we’re looking at 775 as secondary support. 791 becomes resistance.
Peace be with the automakers. Godspeed for my FAZ position.
As of 4AM, anticipated opening candle (10-day/30min):
Comments »Inside Congestion / Upper Channel+100-day MA Resistance / Sector Breakdown
Yesterday, we approached the congestion area. All three major indices are now inside the critical congestion area, a sort of ‘make it or break it’ type of intermediate-term level.
Long-term channels are marked by the purple lines. The COMP has penetrated and is comfortably above the upper long-term channel, however the Nov low-Jan/Feb consolidation level provides resistance. The COMP’s volume remains level, stable, and without drop off. The DJIA closed slightly into congestion. March’s volume cannot be rivaled by any other month in the DJIA’s entire history. The SPX entering congestion can be seen in the 2-month close-up below. Targets are marked with a red box.

The 100-day MA has become a critical level because the SPX & DJIA have not met it since June 2008 (August 2008 for the COMP). Many indicators indicate increasing overbought situations, but I won’t initiate committed short positions until one of those advanced distributional sell-off days (ADS) occur. Shorts who shorted early, even the strong hands, are feeling intensified pressure at this point, and I can assume that many of them are folding their cards as each day goes by, unless they shorted months ago.

In addition, during these times, I like to breakdown each sector and analyze them individually. All are either in continued uptrends (XLK, XLI, XLP, XLY, XLB) or in bullish consolidation patterns (XLF, XLE, XLU, XLV). Since all sectors are not moving in tandem, it is contributing to the large number of indecision days and large intraday swings. The ascending triangles have a higher chance of breaking out to the upside, while the sectors in continued uptrends are threatened with a pullback as they enter/or are approaching congestion zones.
GDP/Claims Today / Approaching Major Congestion
Has nothing to do with stocks, but it is the coolest animal video I have ever seen:
[youtube:http://www.youtube.com/watch?v=LU8DDYz68kM 450 300]
A few things. Don’t forget about GDP and Jobless claims coming out today at 8:30AM EST. The GDP consensus is -6.6% with a range of -6.9 to -6.2. The previous reading was -6.2%. Claims are expected to come in at 650K with a range of 640K to 670K. The previous reading was 656K. There will definitely be some movement today.


As for the market, there are a few things to point out. First, the COMP is above the 100-day MA, something it wasn’t able to accomplish since August 2008. The DJIA and SPX are not there yet. The WTF pattern, which allowed the market to bounce, occurred at the bottom end of the up channel, 3PM as usual. Beyond SPX 800 lies major congestion which is the area where we consolidated for a month before the major gap down.
On the 6-month SPX chart, obviously there are a lot of lines. This may indicate that the market may be boxed in. There are more support and resistance areas than usual. Immediate primary support is at 800 and immediate primary resistance is at 825. The secondary support level is at the 50-day MA or the upper boundary of the bullish broadening wedge, around 790-795. Secondary resistance is at the 100-day MA (for the SPX) at 840 and then the upper long-term channel at 850. Those are the levels to be watching.
Comments »


