Well, now, in light of the new rules about this here fine establishment, I guess I will not talk about when I am entering or exiting a position using The PPT overbought and oversold indicator. I did need to wipe a little sweat off my brow last week, but as I look at my purchases now I am quite happy. Y’all will simply need to be content listening to me crow about the magic.
I mean, we can’t have ME getting banned, can we? You would miss me, right?
Bueller? Bueller? Bueller?
Ach, I am hurt.
Dipping my toe back in the water here on this oil and gas bit. If something doesn’t bite it off I might put a foot in later.
BIG gas injection last week of 95BCF. Way above average and way above estimates. And this in the middle of summer. Definitely not a bullish injection.
I am actually not here to argue a bull or bear thesis on natgas as I think it simply trades alongside coal as a driver, and actual storage is not in the precarious situation it was a couple of years ago. What I wanted to do was smash a bullish natgas note as I think it is representative of what will happen this earnings season as analysts are proven consistently wrong across the next month.
CS popped off with the following on Pg1:
We believe the stalling of the horizontal natural gas rig count and the decline in the natural gas rig count (down 12% since recent peak in Aug 2010), should lead to a moderation in the growth of natural gas production going forward.
Under this chart on Pg1:
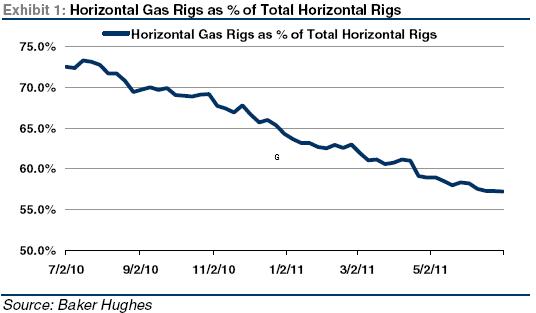
Now, I am cherry picking my quote here as he does put words around this quote describing the next chart. But, the next chart is not on the front page with all these words that eventually lead to his bullish conclusion. His conclusion is carried in the chart above.
I will put the whole quote below, but look at the following chart and keep in mind it was on Pg4. Not even on Pg2, but on Pg4. Does this look like a chart that adequately describes a coming decline in natgas production?
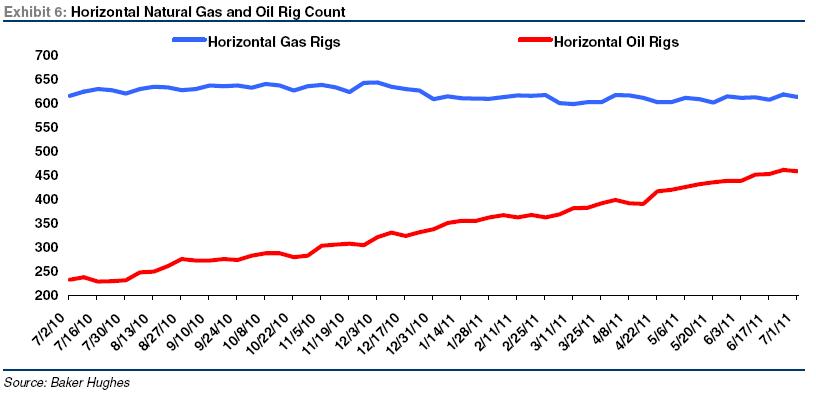
Looks more like a chart showing increasing oil production. He says down 12% since aug10 – is this referring to the top chart of gas rigs as a % of total? If so, this is a gross misrepresentation because gas rigs in the second chart are def not down 12%, and the only reason “% of total” is down is because so many oil rigs have come up.
Get ready for a whole bevy of manipulation like this in the coming season.
Anyway, here is the full quote from the first page:
Horizontal Gas Rig Count Growth Moderating. More efficient horizontal rigs continue to climb to record highs (up 65% to 1,073 from the recent trough of 650 in August 2008). Notably, the horizontal natural gas rig count has remained relatively steady increasing by only 5 rigs year-to-date (up 1%) and down by 2 rigs (essentially flat) year-over-year to 614 rigs. We believe the stalling of the horizontal natural gas rig count and the decline in the natural gas rig count (down 12% since recent peak in Aug 2010), should lead to a moderation in the growth of natural gas production going forward. On the other hand, the horizontal oil rig count has increased significantly to 459 rigs from 338 rigs (up 36%) at the beginning of 2011 and 233 rigs (up 97%) from the year-ago period driven by higher oil prices.


2 Responses to “Massaging the data”
shaz
nice post!
Po Pimp
Oh me oh my. This guy completely misses the bigger picture; in other words I am in complete agreement with you AB.
Let’s see, NG rig count has stabilized. True enough. But does this analyst mention anything about how the number of frac stages per well has been rapidly increasing? In other words you can get the same amount of NG production with fewer wells these days. Fewer wells means less rigs required to maintain current production rates.
Then let’s consider another point this dipshit completely missed. Most of these new oil rigs are in the shale areas. There is quite a bit of NG produced with the oil in these areas. So even though the wells are mostly oil there is also some residual NG coming out. Back in the good old days before the EPA stepped in this NG would be flared off as a waste product. Not any more because of air emission regulations. This NG is also adding to already high storage levels.
Lastly, a lot of new NG production has come as a result of joint ventures between small E&P companies and much bigger integrated companies. Think of the deals announced last year between the Chinese, Royal Dutch Shell, XOM, etc and the mom and pop operators that live quarter to quarter. So long as the small E&P’s are drilling with “Other People’s Money” they are not going to cut back in a significant manner. This is why production has not crumbled despite shitty NG pricing.
My $0.02 any way.