iBankCoin
Joined Jan 1, 1970
204 Blog Posts

Jobs Report

Now that the bear market is officially behind us, time to focus on earnings reactions again. And tonight, it’s the always interesting Apple.

It’s either tricky or pointless in this environment to try to hazzard a guess as to what the market expects for an earnings reaction. The old earnings spikes took AAPL options to about a 60 volatility ahead of the number. Now it’s in the mid 90’s, so it would need a gigantic options crush just to get to the old highs.

Market volatility has declined about 25-30% off the peak (in about a day). So if AAPL does the same thing, that puts it in the low 70’s. So for what’s it’s worth, the options expect a 10% move as best I can tell.

Sold some OTM puts here as a “starter” position after a long 3 hours or so with no AAPL exposure (probably equaling the longest I’ve gone without something in AAPL all year,lol).

Comments »
10 Day Vs. 30 Day Volatility

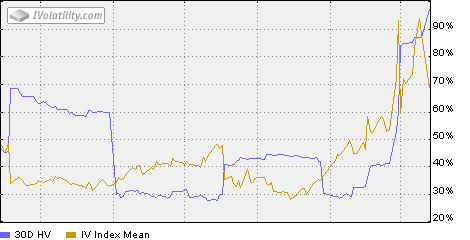
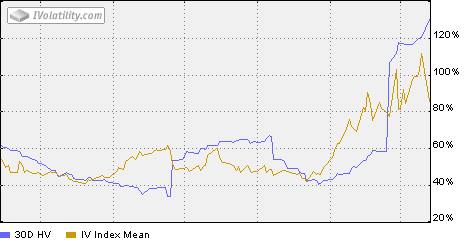
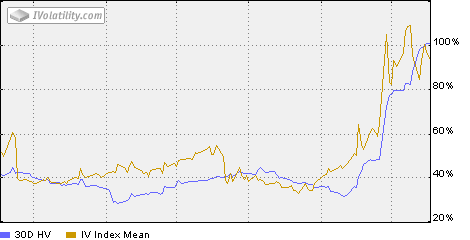
Got some questions/comments as to why I used 10 Day Historical volatility the other day to measure actual stock volatility, as opposed to say 30 day HV, as in most standard volatility stats, like the VIX.

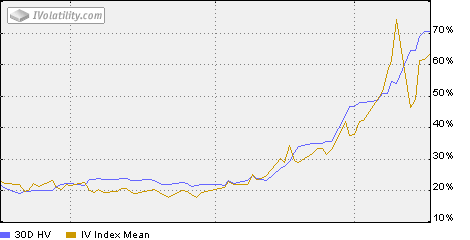
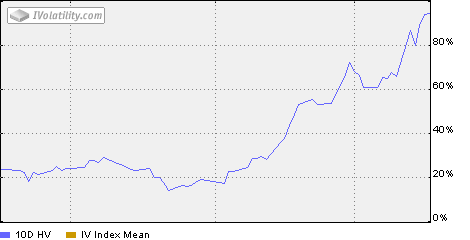
Short answer is that the shorter the time frame, the less data and the “noisier” the measure the gets. And the better it demonstates stock volatility in the here and now. The blue line in the charts here from top to bottom shows 120 day HV, 30 day HV and 10 day HV over the past 3 month’s. If you’re sitting at home trading stocks, which one closer approvimates what you’re *feeling*? Pretty certainly the 10 day measure.

Long answer is that there’s no particular reason why the timing on the HV and IV need to match. They measure two completely different things. IV is the market’s guess as to the volatility of the underlying product, in this case SPY, over the next 30 days. HV is a moving average of the volatility of the stock itself over the past “x” days. IV looks forward, HV back.

Bottom line is an option prices based on expectations of future volatility. Sometimes there is anticipated news like an earnings report or FDA announcement, and future pricing has relatively little to do with past stock action. Other times, like now, it’s all about what we’re feeling each and every day. And right here, right now, that 10 day measure expresses it best imho.

Comments »

A Decade of Volatility

OK, more visual evidence stocks are absurdly volatile?

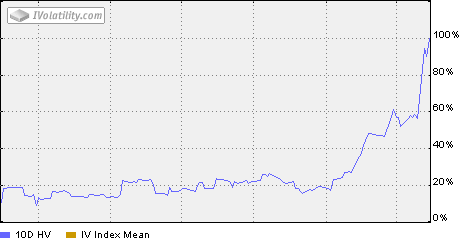
The graph above shows 10 Day HV over the past 6 month’s for SPY. That’s the volatility of the stock itself based on the move from the day before and the day’s range, calculated as an MA over the past 10 trading days. And it’s about 100 now. Meaning that 80 VIX STILL doesn’t quite get to what’s going on each and every day.

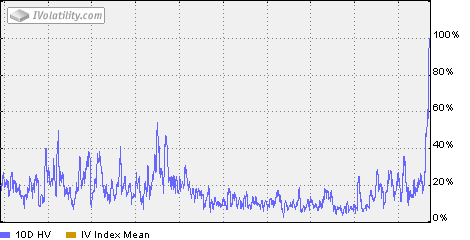
How high is this number? Down below graphs it for the last decade. And amazingly we never got close to this level.

What’s more, you don’t even capture the full effect of most of what we’ve seen, the stunning moves within each day from one end of the range to the other.

Of course it doesn’t mean volatility is a buy at these levels. It means it has been a buy so far, but this won’t last forever, we’ll settle in. I think the VIX futures and options are incredibly dangerous trading vehicles, but they do yield some good info for future volatility expectations. And to reiterate from yesterday, the *market* expects to see a Nov. VIX in the mid 40’s, and a Dec. VIX in the mid 30’s. Still way high by old standards, but considerably lower than here.

Oh, and one other little factoid. If I perform this same exercise on the QQQQ, it is NOT at decade volatility highs in either the options or the 10 Day vol. of the stock. We’re about 90 now in the stock, but it blipped here 6 distinct times between 1999 and 2001. And blipped near here a few others. Important to note though that the first few times were actually while tech was still bubbling to the upside, so it’s a bit of a different pattern.

Comments »

Will Hank Pull An Expiration Bunny Out of His Hat?

Our illustrious leaders have a fine tradition in the past year of saving some of their best ammo for the late Thursday/early Friday window so as to coincidentally get their best bang for the buck.

It’s the Gamma Effect, something we’ve gone over here periodically. Long story short, a Friday gap maxes out the pain to options shorts as they have to chase and cover as indices and stocks fly thru strikes.

But I suspect it won’t happen this go around for a variety of reasons. The chief “option-y” one is that we are in a 60 VIX world now. No one is putting their finger over options shorts until they have officially expired. And there’s enough premium cushion in them to withstand bigger moves. In other words, if an OTM call still has $2 in it, as opposed to 20 cents, you can let the underlying ride that much further before you even see a loss, much less a loss you feel the need to chase and cover Throw in that call shorts probably have some overpriced put shorts and the cushions get bigger.

Bottom line is we’re already pricing in these gigantic move days, not sure exactly what Ben and Hank can add to that at this juncture. Another rate cut? More money into the banks? Another lending facility? Ritualistic Execution of Shorts? Been there, done that.

Comments »

We Don’t Need No Stinkin’ Earnings Bid Up

So a funny thing happened as we watched the market implode and roar back. All of a sudden it’s earnings season.

What’s a tad unique this time around is that you really need some incredible skills to differentiate the standard earnings bid up in options from the overall bid up in options we see everywhere.

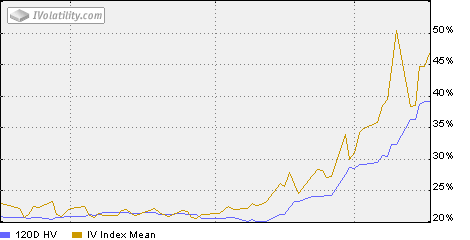
Take these two charts. Up above is GOOG, which reports after the close tomorrow. Down below is RIMM, which came out a couple weeks ago. If the recent patterns look identical, it’s because they essentially are identical. Each hit a 52 week high in the spike on Friday, and each dropped about 20% off that high. And each sits roughly double the old “normal” levels.

You could assign those same attributes to most stocks, as well as the market itself.

So bizarre as this may sound, you are actually getting a good deal on buying GOOG gamma ahead of earnings, although more so in Novs than Octs. On a relative basis in that the options would likely trade here anyway in this environment. Of course even with the drop, GOOG options are very high, as before this move, 50 was the 52 week high in 30 day normalized volatility.

Comments »

Trading the VIX

Interesting that in this runup, I literally did not get one email or comment regarding the trading VIX products.

Generally what transpires is the “cash” VIX runs, but “trading” VIX positions don’t budge. And owners of VIX upside wonder wtf happened.

But none of that went on this go around. Could it be some self-selection, that is to say everyone has either figured out how this pup trades, or just gave it up? Could it be the VIX rallied so much that even though trading VIX longs underperformed, they still did so well that it owners were happy?

Probably a little of all of the above.

Just to refresh, because it can never hurt to reiterate, the VIX itself is an estimate of a normalized ATM option in SPX with 30 days until expiration. A VIX future estimates where that VIX will be on the day of expiration. In other words, buy a VIX Dec future, you are betting on where traders on December expiration will expect SPX volatility 30 days ahead from there. A VIX option is a cash-settled European exercise bet on where the VIX will be on the day of expiration.

VIX futures and options virtually always underperform on big VIX moves. And there’s no set relationship between any future and the VIX itself, any spread can (and did) happen.

Keep in mind that VIX oct futures only crossed above 50 a couple trading days ago. And further out VIX’s never got close. Dec’s for example are in the low 30’s. Which remember was high not all that long ago.

Comments »