iBankCoin
Joined Jan 1, 1970
204 Blog Posts

GLD Member

Looks like there’s some GLD options in them thar hills. Or something like that. This from Steven Sears in Barrons (hat tip EL).

ONE OF THE BEST THINGS about StreetTracks Gold Trust (GLD) is that it trades at about $86. It’s one of the worst things, too, because investors have not been able to use options to hedge and speculate on GLD’s journey from a 52-week low of $63.39 to a high of $100.44.

All of that is about to change.

After about four years of waiting, wanting, and whining, options on GLD could be listed as early as May 30, according to the Chicago Board Options Exchange.

CBOE, like other options exchanges, is waiting for the Securities and Exchange Commission to issue an approval order for what is arguably one of the most-anticipated options products to be launched in the past five years.

The introduction of options on GLD is expected to be followed by options on other commodities, such as silver, furthering blending the securities and commodities markets.

I plead guilty to some of the whining,  so glad this may finally happen. Really glad in SLV, assuming that one comes next, just tough to trade heads on when it gaps $5-$7 at least one day each week.

To the best of my understanding, you had regulatory and trader “turf” battles going on. Commodity futures options traders did not want this day to come; nothing like massive competition in a replacement product to tighten up those spreads.
We had a similar situation in SPY options. The CBOE has an exclusive (and $2 wide markets) in SPX and fought tooth and nail to avoid listing. They took forever to get to market, finally traded, and instantly became an indispensable product. I suspect this will take a similar path.

Comments »

Blame Canada

Well, what a fun week.

Since I am on a self-imposed moratorium, the only VIX I can mention is the bikini to the left, I would just highlight that if she was a Fear Gauge, she now would reside in overbought territory based on her 10 Day SMA. If you think this week is a blip in the uptrend, that’s a short term buy signal. If you feel the last couple month’s were just a pause in the overall bear market, than disregard.

Regression to the mean, or at least regression to the June Future? It is now a moving target and still 3.5 points north of here.

But enough about options. What about oil? Why is no one on TV talking about America’s Oil Crisis? I want answers. I don’t care where it goes from here, what am I, a trader or something. I want to find out who to blame.

Anyway, enjoy the holiday weekend. And remember, as you fill up that tank to sit in beach traffic, or go to the market for some food to barbeque, just be thankful we have no inflation.

Comments »

USO Tour

So I hit up the 30 day volatility chart of USO expecting to see……I don’t know, something interesting.

Pretty much neither here nor there I have to say.

But wait, there’s more. Lots of chatta about Oil Contango on the TV. Sounds more like a Cinemax movie than futures premium over spot though.

And hey, we have “volatility contango”. Longer dated options trade higher than shorter ones. Which in and of itself is unremarkable, I mean we have the everywhere now.

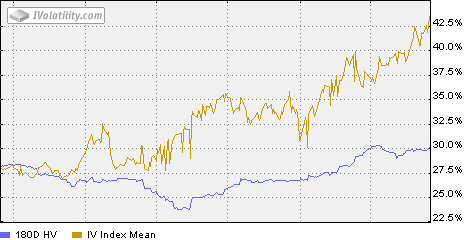
No, what makes it significant is that longer term volatility has spiked to 43, roughly the 52 week high of the 30 day measure. And that is very unusual, seeing long dated options trade at the peak level of the shorter term measure. I have no recollection ever seeing that setup in a rising volatility environment.

And as such, if this tells us something cosmic, it will only become obvious in hindsight.

Comments »

VIX and VIX

Bill from VIX and More chimes in with this response to my earlier post. “In my opinion, you can’t make a credible case that the VIX has jumped the shark until there is a blog out there that is dedicated entirely to that silly little nanosubject…”. LMAO.
Actually there’s a distinction here that needs to be made. There is always room for intelligent statistical work on the VIX, like Bill does day in and day out. Quantifiable Edges and bzb trader throw some in as well.
What has to go is the kind of lazy analyis we hear hourly from observers that often have zero clue what the VIX even measures, how a future or option in there gets priced, et. al. . It’s simply the “Fear Index” to them, with all sorts of random magical levels that must mean something because the market turned on them sometime in the past.
Beyond market clues, the best value from the VIX imho is the general trading signals we can glean. A cheap VIX means switching long term stock winners to calls, and/or tightening targets and stops in shorter term trades make sense.
OK, enough about the VIX, time for a moratorium again on discussing it. 
The “options” VIX I mean, not the VIX Swimwear shown here.

Comments »

VIX Jumping the Shark?

This from Condor Options (hat tip Abnormal Returns).

While the VIX isn’t actually a random number, it certainly is just a statistic, and that means many of the traditional tools of analysis simply won’t apply. And the VIX has definitely received too much attention of late, and is being asked to perform too many roles – market timer, sentiment indicator, and even trading vehicle.

The real question now is: has the VIX jumped the shark? Try as we might, it’s getting harder and harder to find a source whose daily market commentary doesn’t feature at least a casual nod to VIX action, and more importantly, those passing references almost always describe it one-dimensionally as “the fear index.” A Google Trends analysis suggests that the VIX has become a permanent fixture in both financial journalism and among the terms for which punters like us regularly search ………… The ubiquity of the VIX is as recent as early 2008: while spikes in searches and in news coverage matched spikes in the index itself during 2007, what we’re seeing now is a fairly steady stream of stories and searches even during a market rally. This may mark a fundamental shift, in that the story used to be, “market selloff = VIX spike = people are scared!” but is now “hey, look how low the VIX is going!”

There is a lot of merit in this, although I would suggest the infestation of the VIX into everything has gone on for much longer.

The Pundit Class discovered this thing in earnest during the tech bubble meltage and have overanalyzed it ever since. And I plead guilty to participating in this overparsing.

The VIX is just one tool in the shed., and a very imperfect one. It is an estimate, and as such, there is a boatful of noise in the number any time you look at it. At the end of the day, it tends to confirm something you already knew. Back in January and March the VIX spiked as the market got plowed and peaked on those big down gap days. Guess what, emotions got extreme.

What about now? Do we need a VIX chart to tell us the market has traded within very tight ranges, and options have sensibly gotten way cheaper? Or that a bull move got a bit extended and complacent?

I would suggest not.

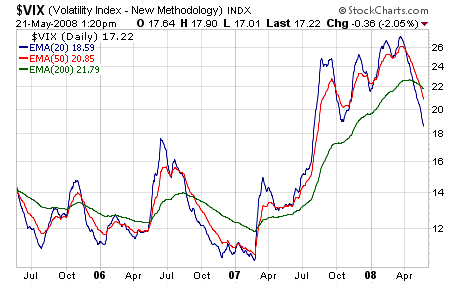
Going forward, we should forget about the blips, myself included. A move from 18 to 17 is utterly meaningless, as is a move back to 18, et. al.. The charts here are for 3 pretty basic EMA’s without the actual VIX.

And we should concentrate on looking for divergences, subjective one’s. Yes the VIX is very weak now, yesterday excluded. But it should be weak now given the backdrop of a slow-moving up market, holiday week, little news flow, et. al. And if/when the market stops this little dip, the VIX will get blasted again.

We need to stand up and notice if the VIX holds firm in the next hint of rally, until then it does not tell us much.
Comments »

Hot Oil

Hey, they are actually buying options somewhere. This, from Briefing.
OPTNX Options Radar: Seeing large sized July call buying in oil names XOM, CVX & BP

With the stocks trading at 52-week highs and oil at all time highs, we’re seeing large sized July call buying in a few of the major oil names — XOM, CVX & BP — indicating potential positioning for continued upside in these stocks… In XOM, the activity is concentrated on the Jul 100 calls, with volume of 33.7K contracts vs open interest of 37.5K, pushing implied volatility higher by 4 pts to 27%. In CVX, the most volume has traded in the Jul 110 calls, with a total of 28.2K contracts trading vs open interest of 337, pushing implied volatility up by 4 pts to ~28%. In BP, the most volume has traded in the Jul 80 calls, with a total of 28.0K contracts trading vs open interest of 1750, pushing implied volatility up by ~5 pts to 26%… The focus on July contracts is notable, as it more indicates intermediate-term positioning for volatility, with exposure to the upside over the next two months (Jul expiration is 7/18).

I am not not not not not not calling a top in anything energy-related. Not will I at any time. But I would note that stocks to tend to top on increasing volatility, not decreasing. It’s akin to seeing an outside day on a chart, sort of a blowoff.

Comments »