Got some questions/comments as to why I used 10 Day Historical volatility the other day to measure actual stock volatility, as opposed to say 30 day HV, as in most standard volatility stats, like the VIX.
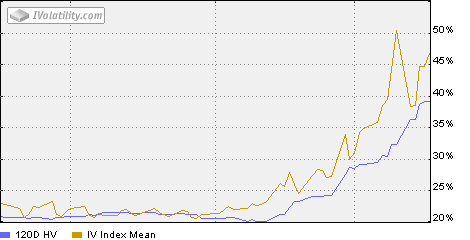
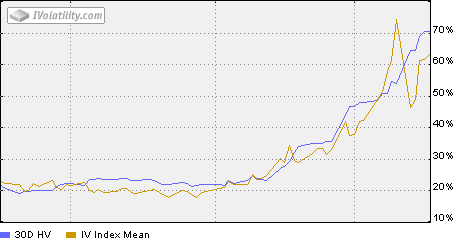
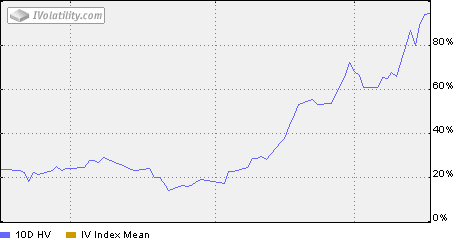
Short answer is that the shorter the time frame, the less data and the “noisier” the measure the gets. And the better it demonstates stock volatility in the here and now. The blue line in the charts here from top to bottom shows 120 day HV, 30 day HV and 10 day HV over the past 3 month’s. If you’re sitting at home trading stocks, which one closer approvimates what you’re *feeling*? Pretty certainly the 10 day measure.
Long answer is that there’s no particular reason why the timing on the HV and IV need to match. They measure two completely different things. IV is the market’s guess as to the volatility of the underlying product, in this case SPY, over the next 30 days. HV is a moving average of the volatility of the stock itself over the past “x” days. IV looks forward, HV back.
Bottom line is an option prices based on expectations of future volatility. Sometimes there is anticipated news like an earnings report or FDA announcement, and future pricing has relatively little to do with past stock action. Other times, like now, it’s all about what we’re feeling each and every day. And right here, right now, that 10 day measure expresses it best imho.


