OK, more visual evidence stocks are absurdly volatile?
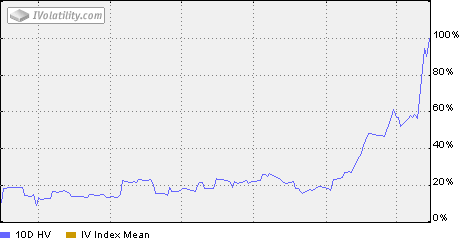
The graph above shows 10 Day HV over the past 6 month’s for SPY. That’s the volatility of the stock itself based on the move from the day before and the day’s range, calculated as an MA over the past 10 trading days. And it’s about 100 now. Meaning that 80 VIX STILL doesn’t quite get to what’s going on each and every day.
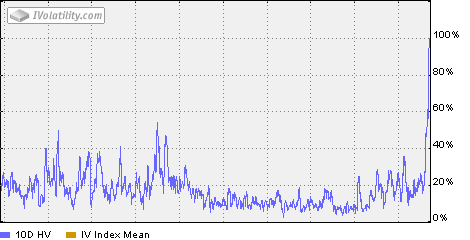
How high is this number? Down below graphs it for the last decade. And amazingly we never got close to this level.
What’s more, you don’t even capture the full effect of most of what we’ve seen, the stunning moves within each day from one end of the range to the other.
Of course it doesn’t mean volatility is a buy at these levels. It means it has been a buy so far, but this won’t last forever, we’ll settle in. I think the VIX futures and options are incredibly dangerous trading vehicles, but they do yield some good info for future volatility expectations. And to reiterate from yesterday, the *market* expects to see a Nov. VIX in the mid 40’s, and a Dec. VIX in the mid 30’s. Still way high by old standards, but considerably lower than here.
Oh, and one other little factoid. If I perform this same exercise on the QQQQ, it is NOT at decade volatility highs in either the options or the 10 Day vol. of the stock. We’re about 90 now in the stock, but it blipped here 6 distinct times between 1999 and 2001. And blipped near here a few others. Important to note though that the first few times were actually while tech was still bubbling to the upside, so it’s a bit of a different pattern.


