In two recent posts, Short Term Breadth Pointing to a Bounce, and So We Got the Bounce. Now What, I discussed how to interpret two of the indicators I use and walked the reader through my thinking when interpreting them. You’ll see that the indicators were accurate in predicting the first three days of this week.
The good news is that both indicators are now aligned which means I feel comfortable looking for a tradeable bounce. This means I expect a bounce that will last 3 to 5 days.
Let’s have a look…Click on the chart to enlarge it.
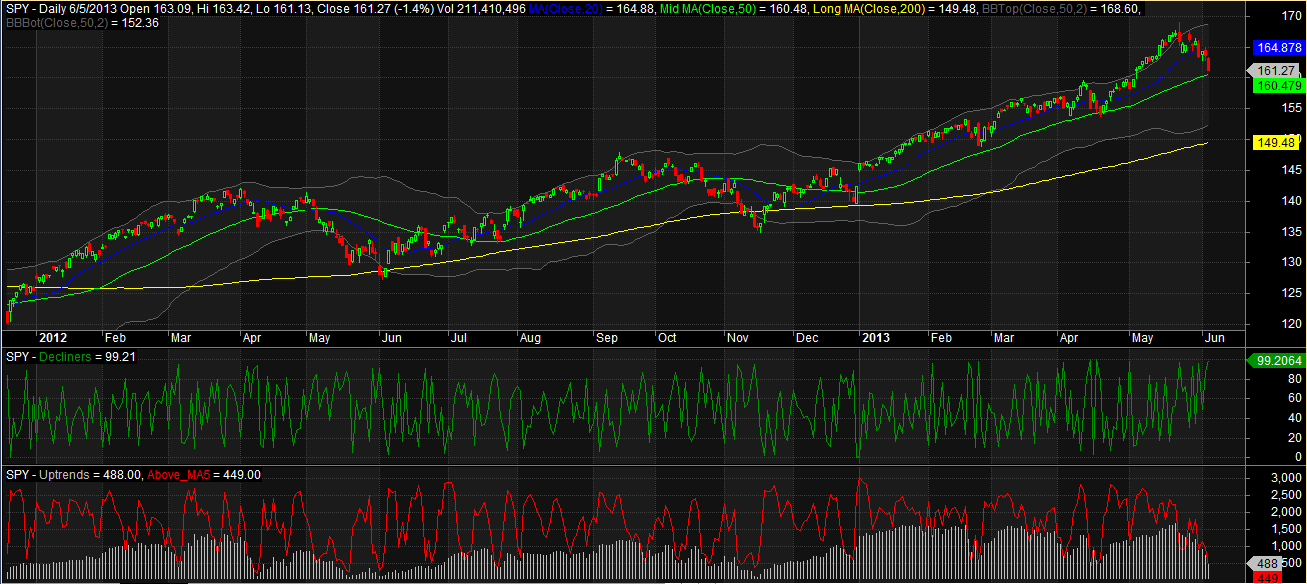
Note that the very short term decline line indicator (green line) is above 99, which means a bounce (or stabilization) is imminent.
The short term “number of stocks above their 5 day moving average” indicator (red line) is also beneath the trigger area of 650 with a reading of 449. This is the lowest reading for this indicator in 2013. The last time we had a reading lower than this was November 14th, 2012, at 388. This date was two days before the absolute low of the Fall 2012 correction.
These indicators do not guarantee a tradeable bounce, but the odds are on our side. Couple the odds with the 50 day average just beneath Wednesday’s close and I’m looking for a bounce.


Interesting.
Thanks Mr. Woody! you’re an ace!
No problem. Just have to study the data and apply a judicious amount of intuition and personal experience.