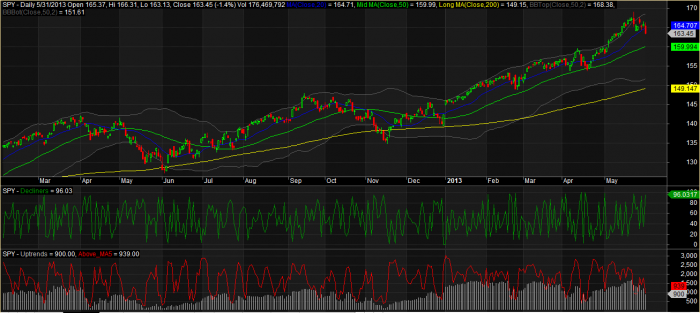
And by short term, I mean very very short term. A signal given from this indicator means a bounce is imminent. For this shortest-of-terms measure, I use a bounded decline line indicator, which simply counts the number of declining stocks, compares that number against previous readings over the last 252 days (one trading year), and then ranks this reading against the others in percentage terms. It is bounced because ranking the reading in percentage terms means it is bounded between 0 and 100.
Let’s have a look…Click on the chart to make it bigger.
The decline line indicator (green line, middle pane) is showing a reading of 96.03. Readings in the 90s are typically followed by an immediate bounce, or at the very least, a few days of stabilization. Once the bounce or stabilization occurs, everything resets.
The red indicator in the bottom pane also measures short term breadth but is better for gauging how sustainable a bounce might be. When this indicator gets a reading in the 600s or lower, and the decline line indicator is also indicating a bounce, then I look for bounces that will work for swing trading. In other words, this indicator can help us find bounces that last a few days or more. Since the indicator is currently reading 939, the market has probably not pulled back far enough yet to yield a swing-tradeable bounce.
The bottom line is that I’m looking for a bounce Monday or Tuesday (at the latest) or some stabilization, but expect that this pullback can continue before we get a good tradeable bounce.


