Keeping with my recent theme of using two indicators to gauge market swings, the bloodbath of the last two days has again aligned these indicators so that they are suggesting a tradeable, 3 – 5 day bounce is ahead. Let’s take a look…
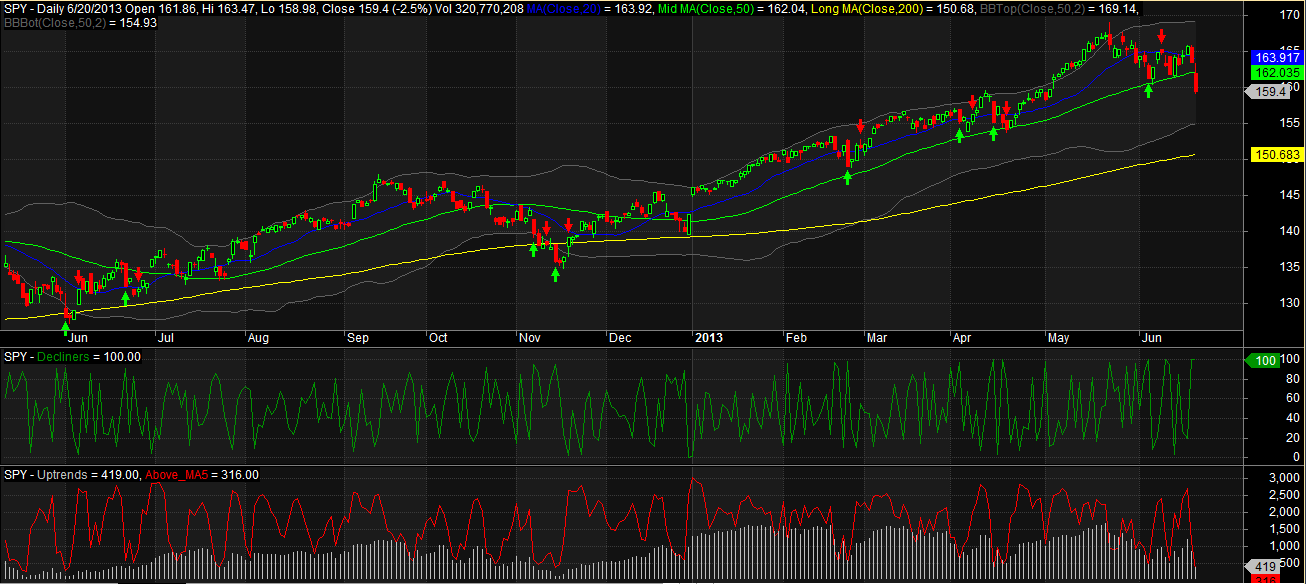
The green Decline Line Indicator is maxed out at 100.
The red Number of Stocks Trading Above Their 5 Day Moving Averages Indicator is reading 316, which is well below the preferred threshold of 650.
As shown in the chart, when these indicators align, a tradeable bounce tends to occur. I set the arrows up to reflect a 3 day hold time after the signal.
The wildcard is of course that we are in a downtrend, which changes things. You’ll note that most of the bounces on the chart above have come during pullbacks in an uptrend. Because of the strength of this sell-off, I’m looking for a bounce that will rise only to the 50 day average. From there, I’m expecting we’ll see the old Bears at the Honey Hole routine.
How $SPY behaves on this bounce (if it does bounce) will help me decide what to do with my long-term $SPY long position.


17+ HANDLES IN YOUR FACE