Last night I wrote about a couple of my indicators, one of which was pointing towards a bounce being imminent.
Well we got the bounce, so now what? Let’s look at the updated indicators, and I’ll walk through my thinking process.
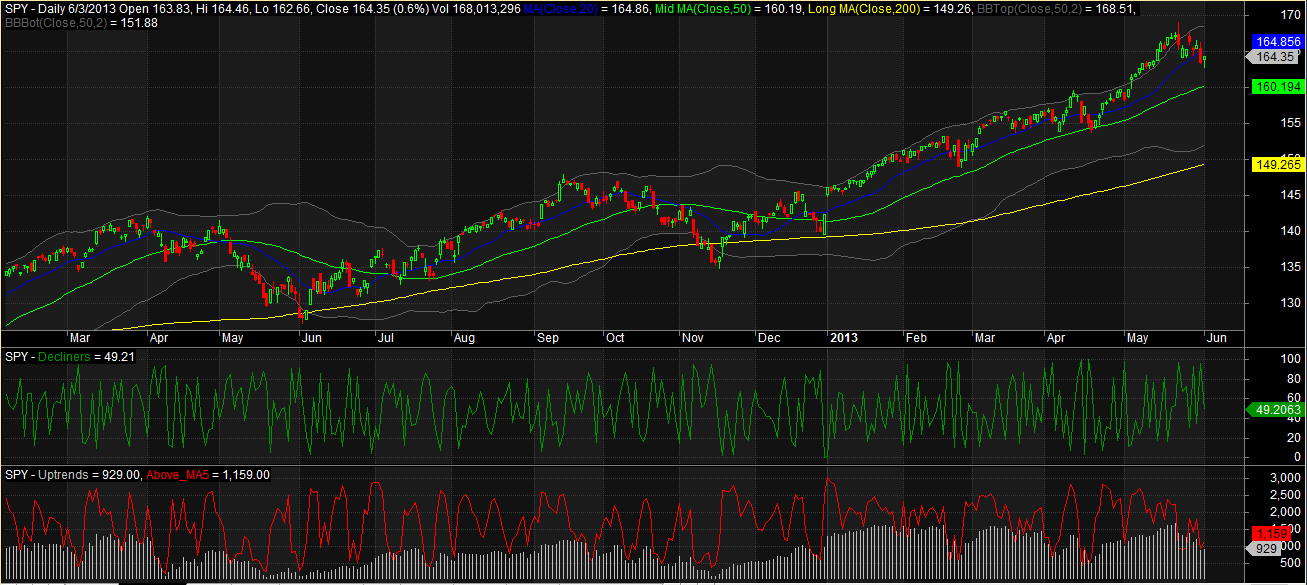
As I mentioned last night, I use the red line indicator, which is a measure of the number of stocks trading above their 5 day moving averages, to gauge how sustainable a bounce might be. The indicator bottomed out around 900 or so. A glance back through this year shows that tradeable bottoms have occurred much lower than the 900s. In February, it was 501. In April it was 620 and 459. In general, I start getting excited at any reading beneath 650.
So what does this mean for the next few days?
With the decline line indicator reading neutral at 49, the imminent bounce has been had. The red line did not reach a level which makes me get excited about the possibility of a sustainable bounce. Therefore, my thinking is that I wouldn’t be surprised if the bounce continues, what with Ben Bernanke and all, but I’d be less surprised by a lower low.
Another pattern than I’m watching is that $SPY has been touching down on and then bouncing from the 50 day average, every couple of months.
The one caveat is that today’s candle, a hammer, and on good volume, has traditionally been one of the candle patterns that I trust the most to signal a low. It has been such a strong signal for me that I’m tempted to allow it to override my red line indicator. What’s a few hundred stocks that are not beneath their 5 day moving average when the day’s candle is bullish? I don’t know the answer to that. We’ll have to wait and see.
This is not an exact science. We couple our experience with our data by using our previous experience to help us interpret our current data.


Really enjoyed this, thanks.
One thought: Chess mentioned in his video today that the hammer candle might not mean as much since it occurred in the middle of the bollinger bands.
But we shall see! Thanks again!!
Hmm, about the candle being in the middle of the bands, that is a good point. I had not considered that.
Thanks!
wood,
o/t, but what are the picks for sector rotation this month?
Ive got qqq, smh, xly, dia, xlf and kbe
Still looking at Biotech and Healthcare and a consumer related fund. I’ll update tonight and get you something more specific…well, on second thought, going to see the Flying Squirrels play (richmond’s AA Giants Affiliate team) so I might not get to it tonight. We’ll see.
thanks .. enjoy the game
Sure looks like we get the lower low. Awesome intuition! Joe