China has been on fire the last two days thanks in part to the following headline:
CHINA ORDERS STATE BANKS/FUNDS TO BUY STOCKS
— FXHedge (@Fxhedgers) August 28, 2023
FXI, China’s large cap ETF, recovered both the 50 & 20 day moving average today, $AAPL also did the same thing. Did the forced buying from China help us find a short term low? Or, is it back to business as usual looking for puts every time we close a 5min candle below vwap?
One name I’m invested in here on the long side is $BABA, which displays one of my favorite setups. Let’s go ahead and walk through multiple timeframes to see why this has become my favorite setup.
1.) China. Paying attention to themes can pay big, if you can get the theme right. Let’s see if the China theme sticks around. $PDD just smashed earnings and $BIDU did last week, both helping the cause.
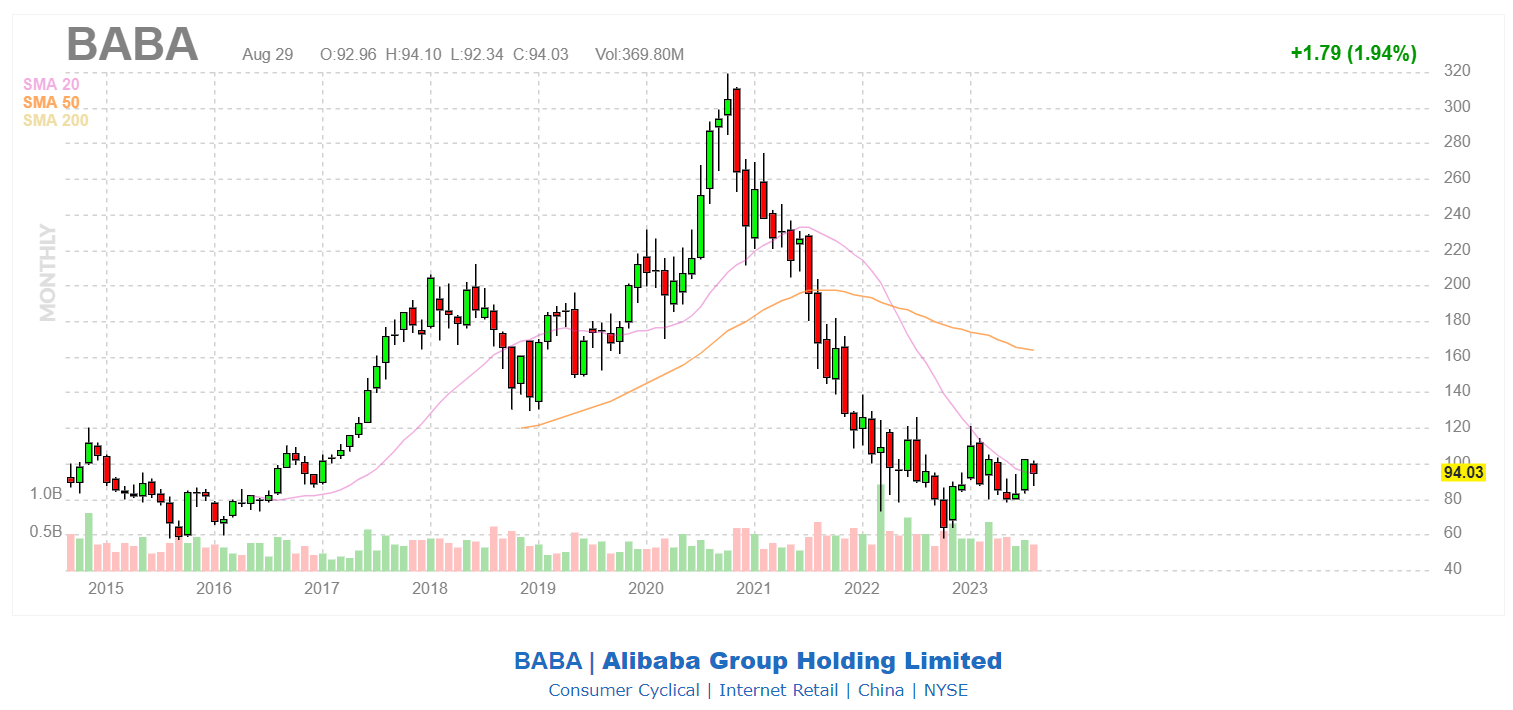
2.) Multiple Timeframe analysis. Pretty much a fancy word for looking at charts in different time frames. I like to start with the longest time frame first, so let’s look at the monthly chart for BABA.
– July was a strong month for BABA, breaking and closing above the 20day moving average. In August, the company reports a blockbuster quarter, yet sold off with the overall market retesting that 20day moving average on the monthly chart. Well thanks to the new China orders, it looks like we will close above the 20 day moving average on the monthly chart, which shows a change in trend.
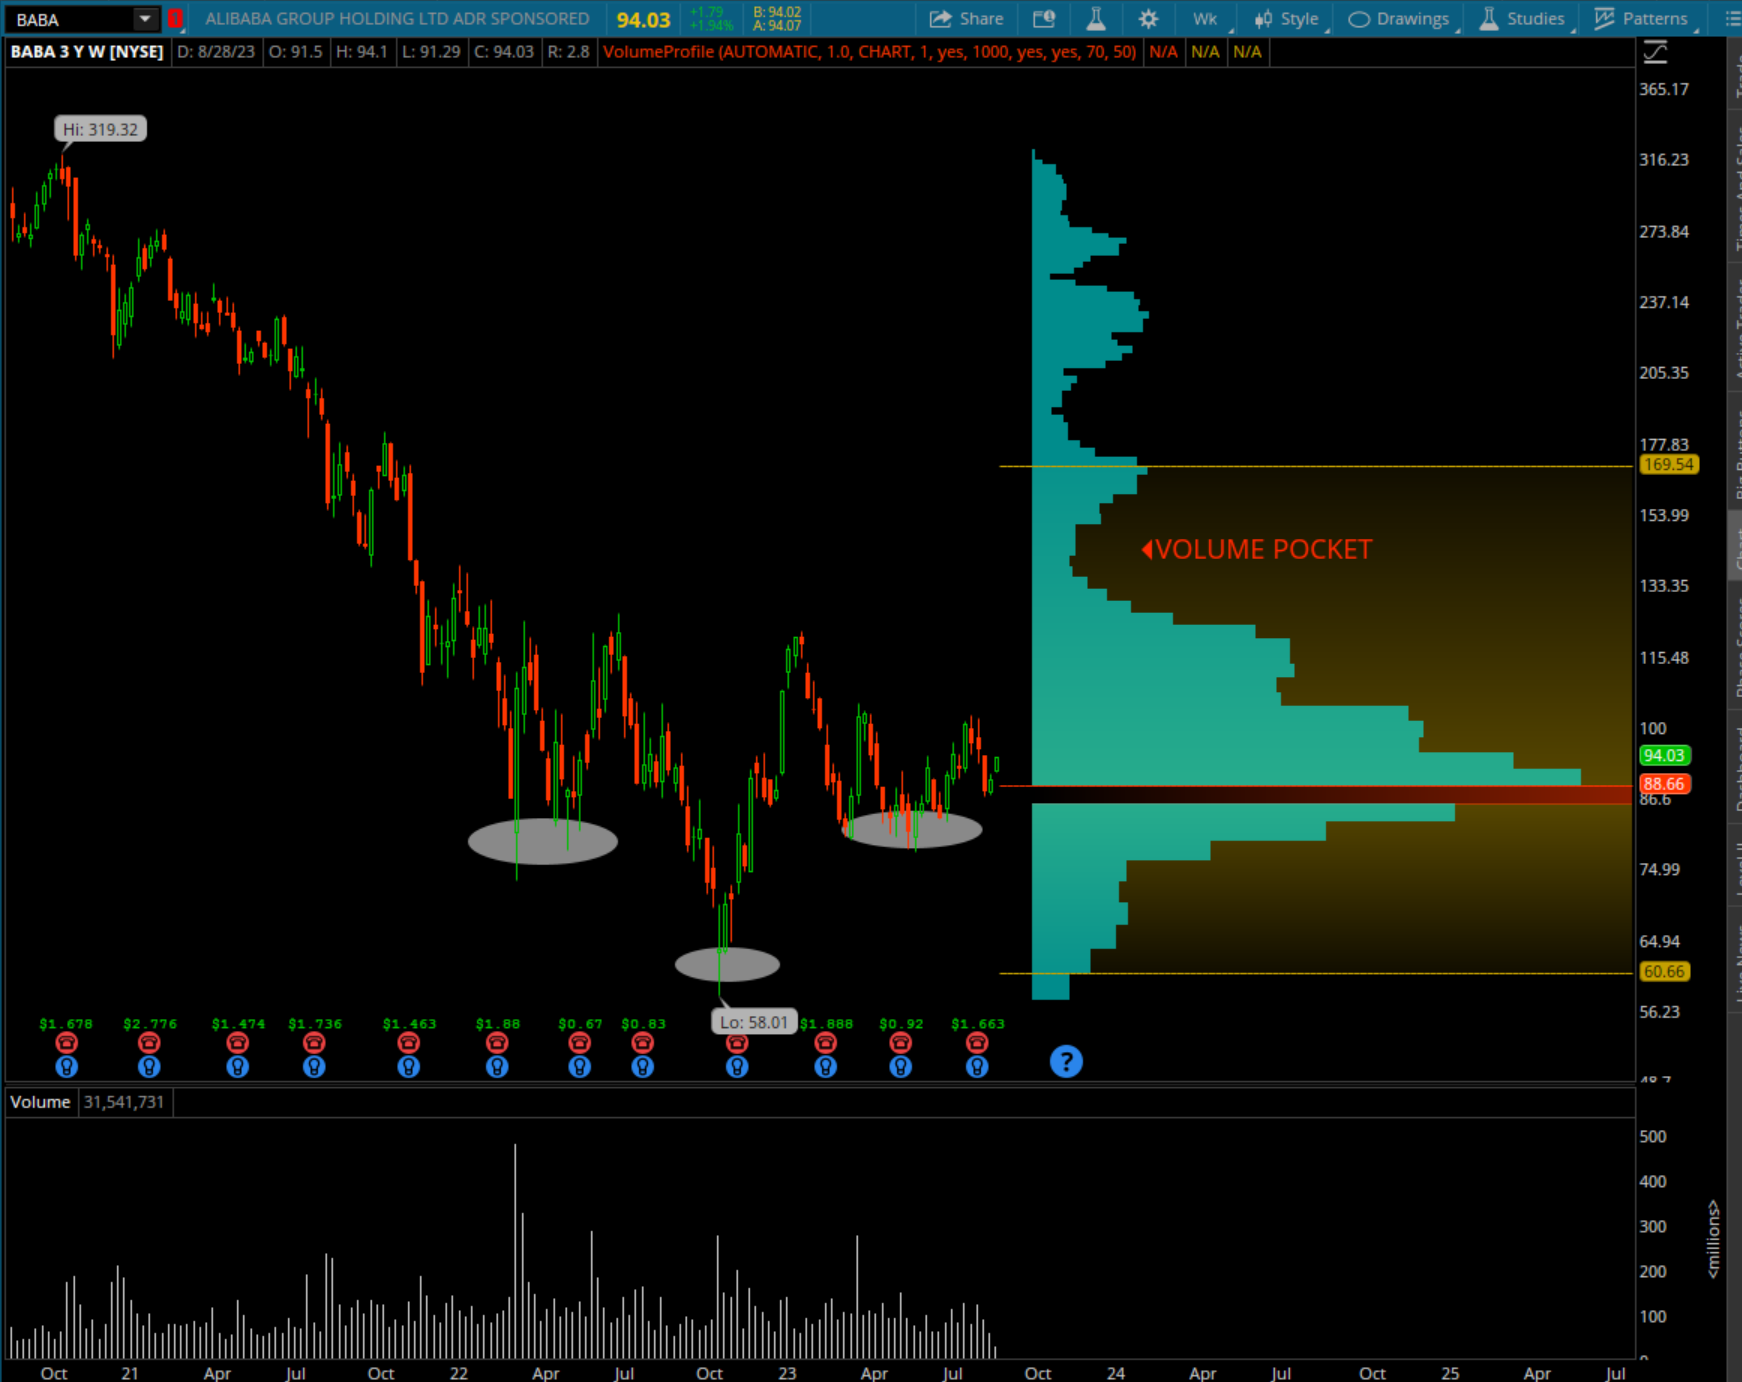
Let’s now take a glance at the weekly chart, this is the chart I like to dive into volume profiles to see if I can find any volume pockets of note. This helps tremendously when looking for price targets. For $BABA things start to get thin above $120, which should take this thing closer to $150-160 to fill this pocket. However, we still have a ton of volume to work through in the short term, so it’s not going to be a straight shot. I do like the inverse head and shoulders pattern = bullish.
 __
__
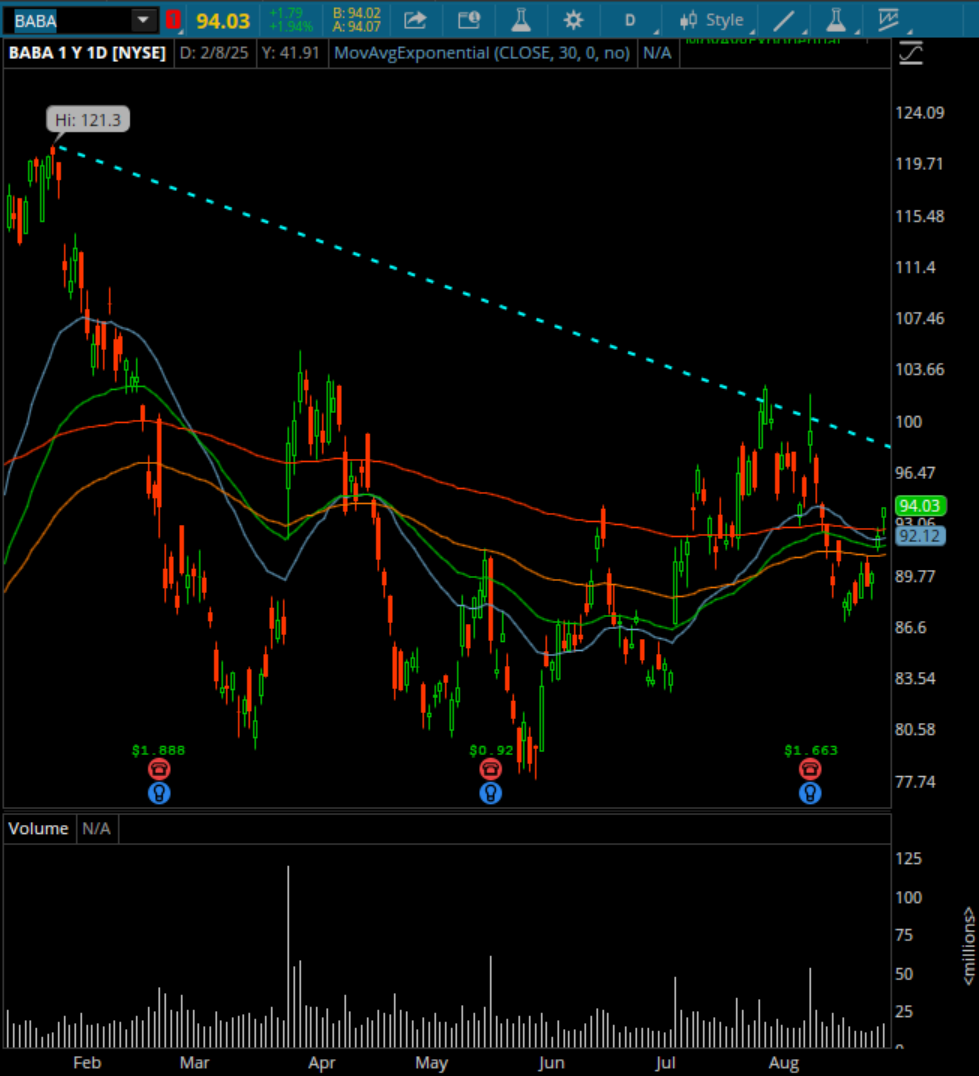
Now to the daily chart, which shows a pattern I love to see develop. Notice all the moving averages, notice how they all converge at the $91-92 area, which is right below price. The creates support underneath and signals a trend change. I now want to see price hold the moving averages to support the trade:
 __
__
In conclusion, short term we have some volume big volume to work though, but price is above all major moving averages providing some short term support. Over $100 and we may get a breakout (see above chart blue dotted line), over $120 and we may get a Kirby Vacuum up to $150.
Disclaimer: Long $BABA common and calls at time of post.
If you enjoy the content at iBankCoin, please follow us on Twitter