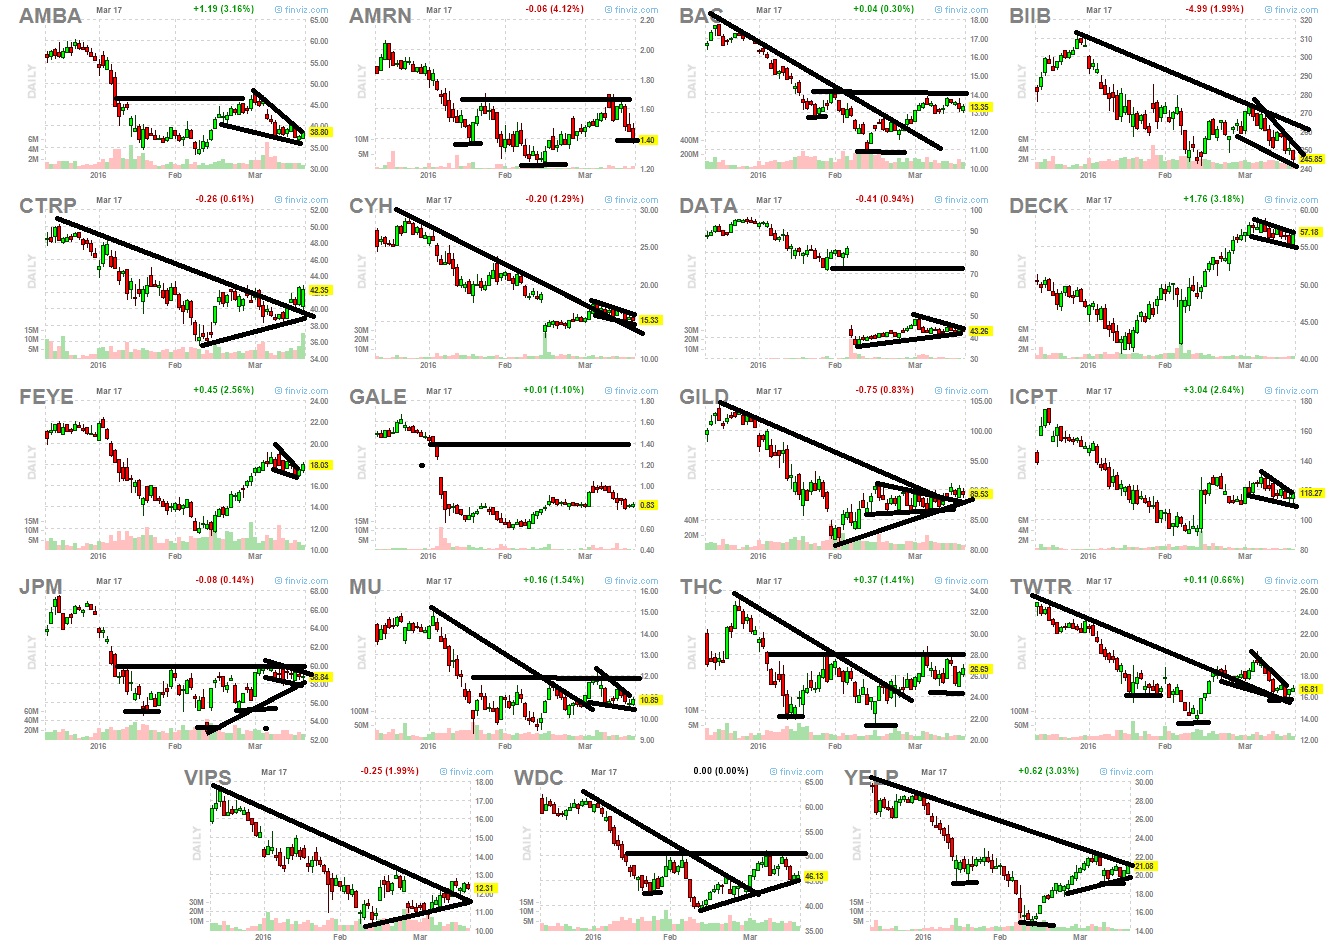
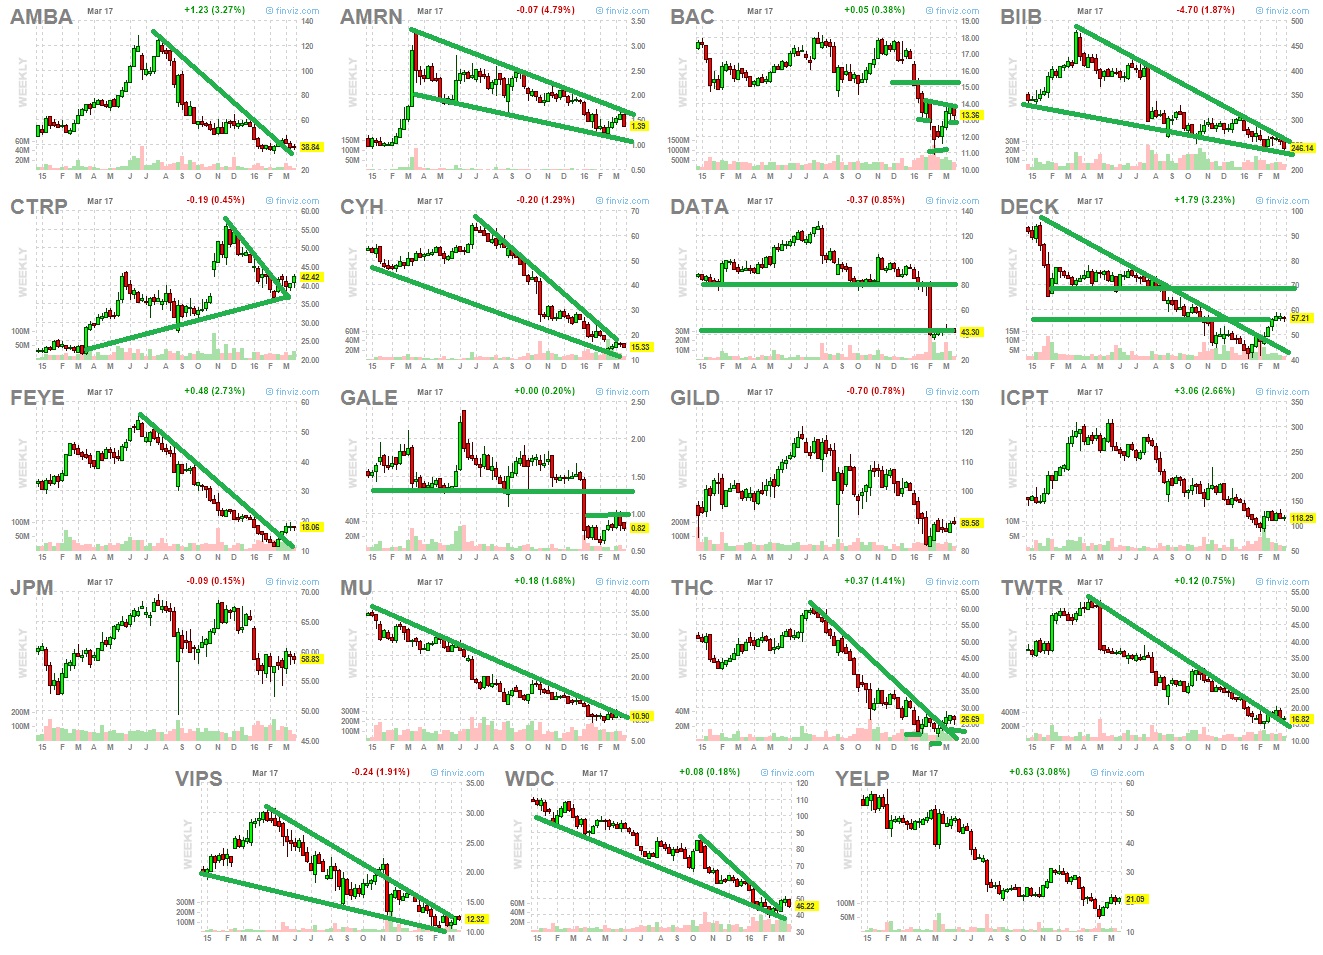
Posting both weekly charts and daily charts to try to show you what I’m looking at.
Method: Manual scan of all stocks that have available weekly options. Using a list that I update 2-3 times a year.
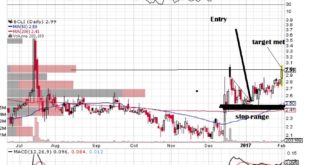
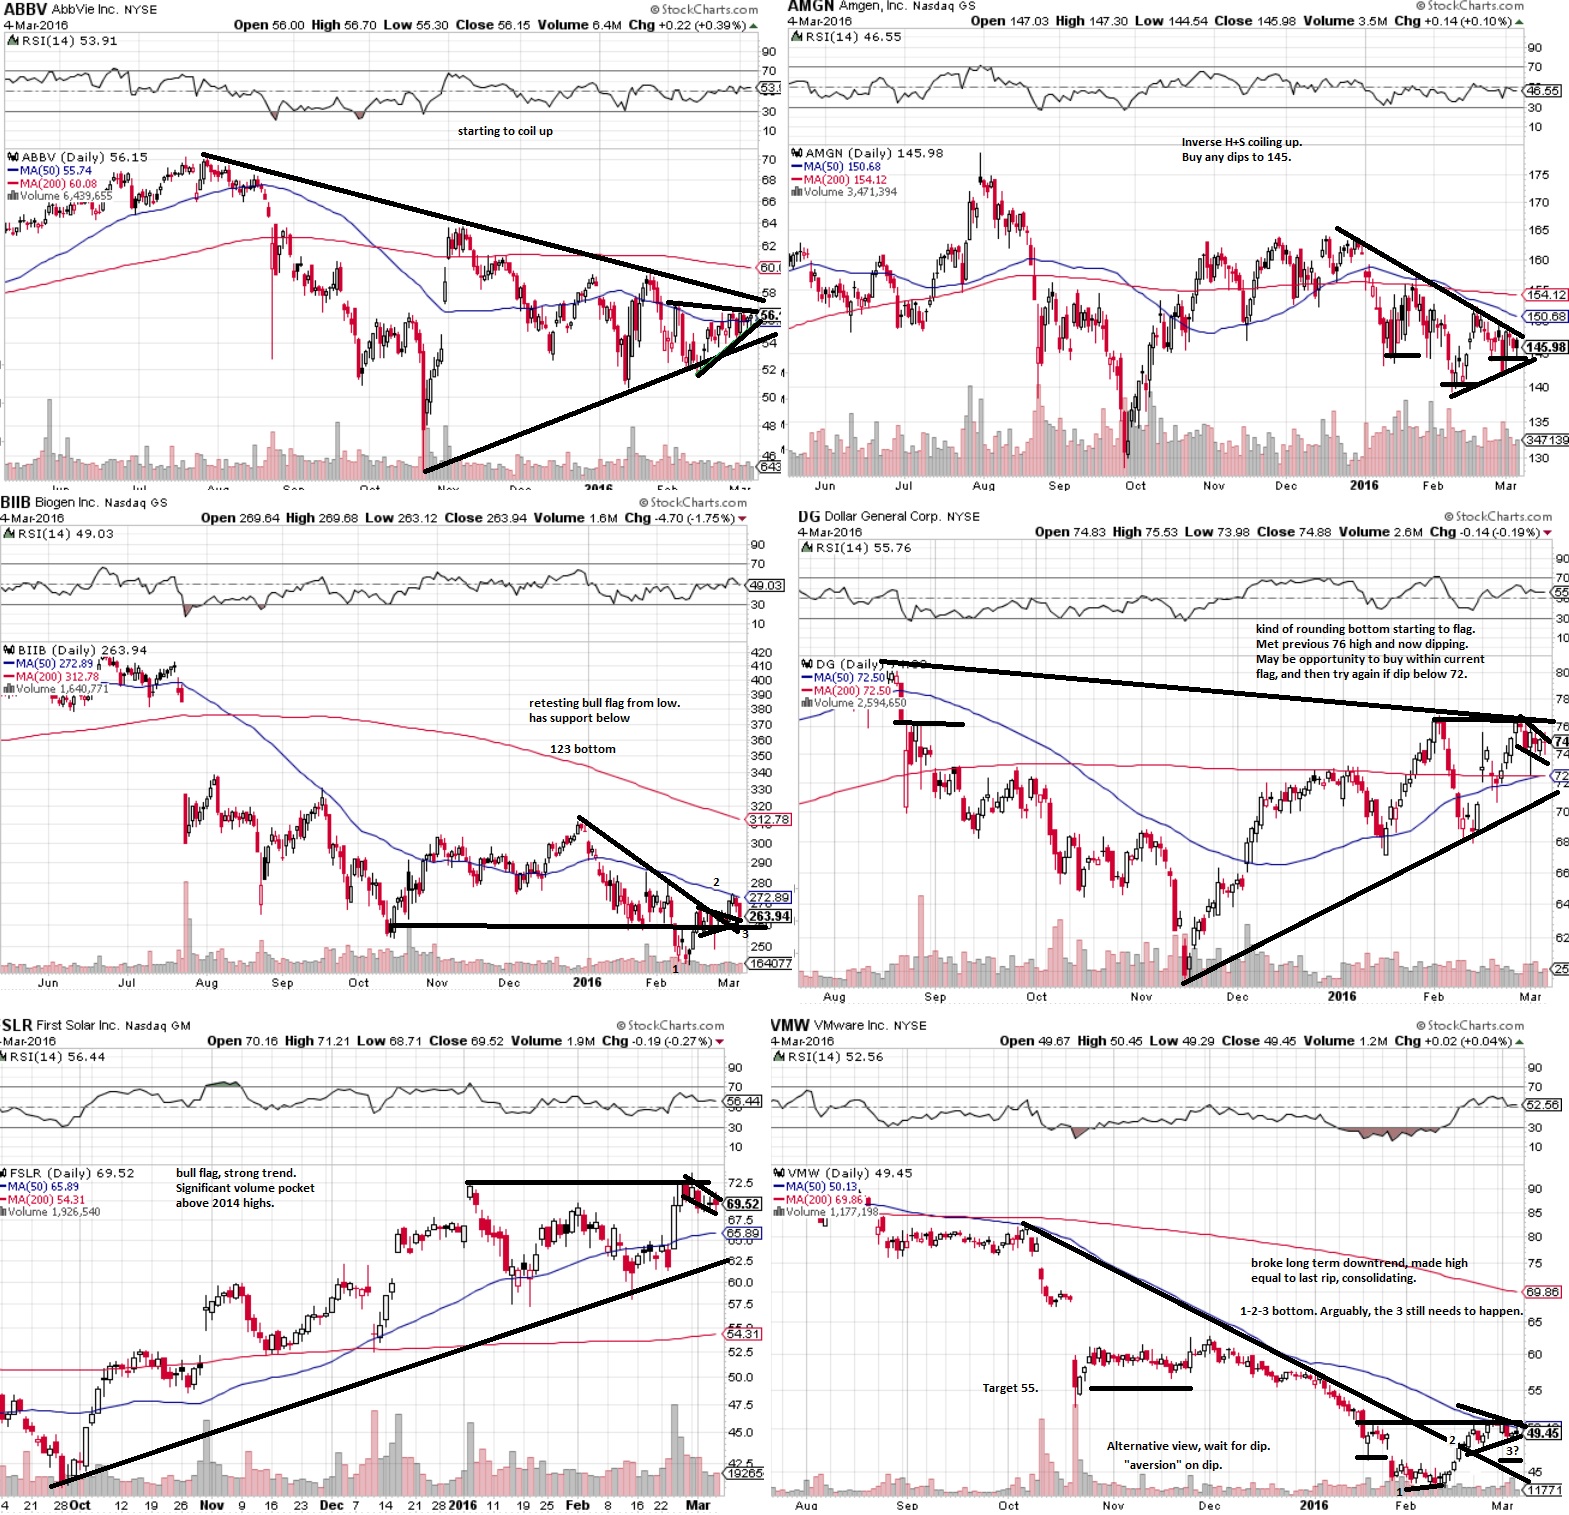
Bullish setups:Usually looking for 1-2-3 reversals. Typically the first low following equal high.. Typically focusing on finding “aversion” sentiment, or in EW terms looking to buy before wave 3.
Bearish setups: Typically focused more on selling retest or resistance and/or with volume profile below and/or with some kind of bear flag or rising wedge.
Bullish list.
Tickers:AMBA,AMRN,BAC,BIIB,CTRP,CYH,DATA,DECK,FEYE,GALE,GILD,ICPT,JPM,MU,THC,TWTR,VIPS,WDC,YELP,
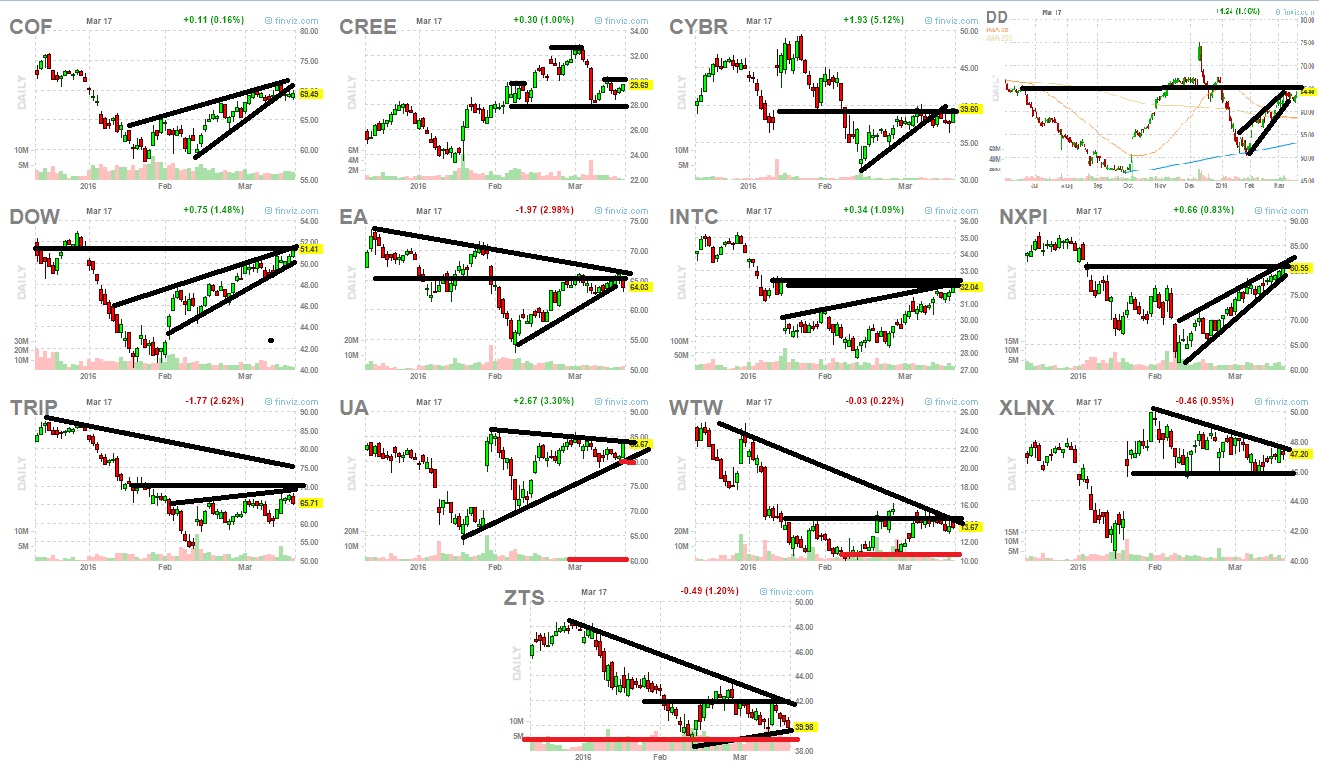
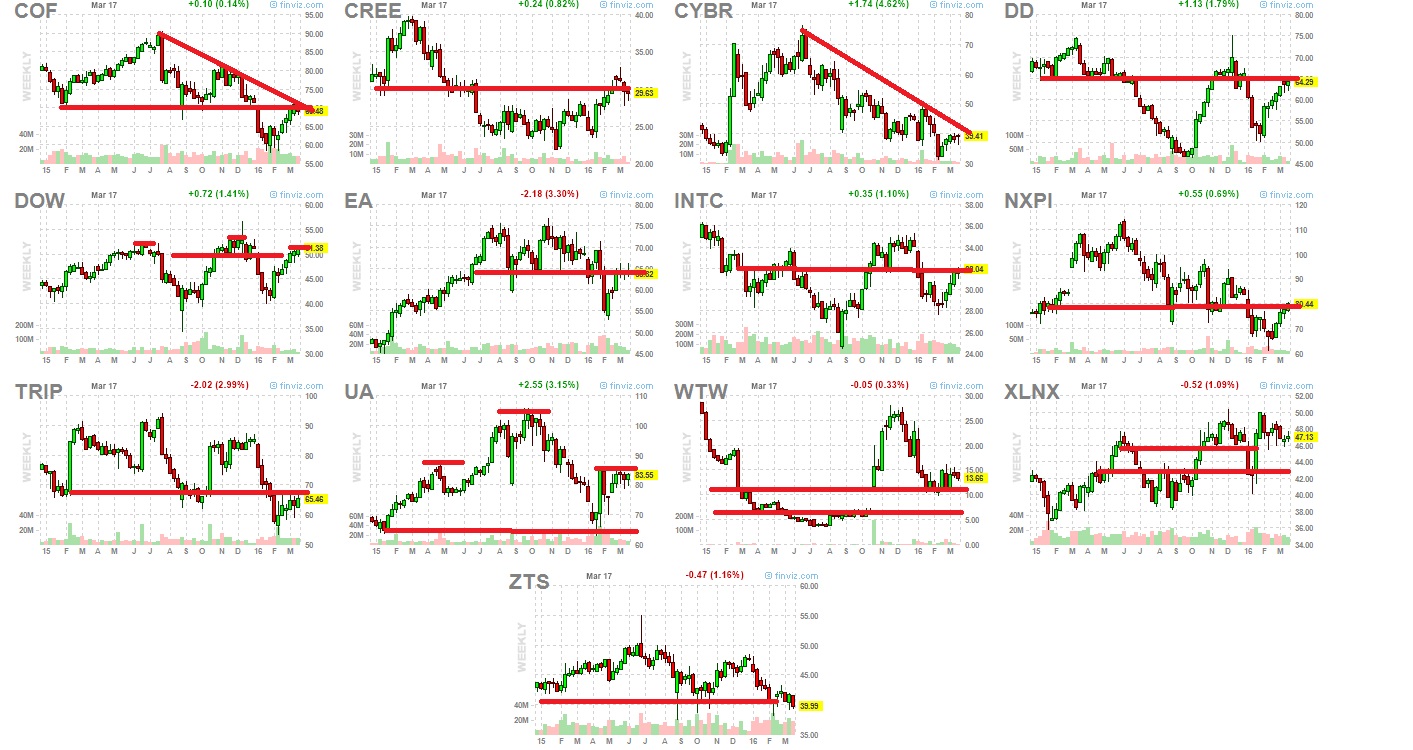
Bearish list.
Tickers:
COF,EA,INTC,NXPI,TRIP,WTW,
CREE,DD,DOW,UA,XLNX,
(not yet) ZTS,CYBR
Bullish (daily charts)
Bullish (weekly charts)
Bearish (daily charts)
Bearish (weekly charts)


Also posted cheapies in AH 2-3 days ago
http://finviz.com/screener.ashx?v=211&t=PFSI,HK,AMRN,CHK,INVN,SPLS,MU,GLUU,HERO,JVA,MOBI,MWW,RGSE,VRNG,YOD,ZHNE,ANW,ESPR,CRIS,ONE,EZPW,KCAP,AXAS,BEBE,CGA,GALT,ABIO,UQM,LIVE,CDTI,SCON,&o=-marketcap