iBankCoin
Joined Nov 11, 2007
1,458 Blog Posts

Worst Breadth of the Year

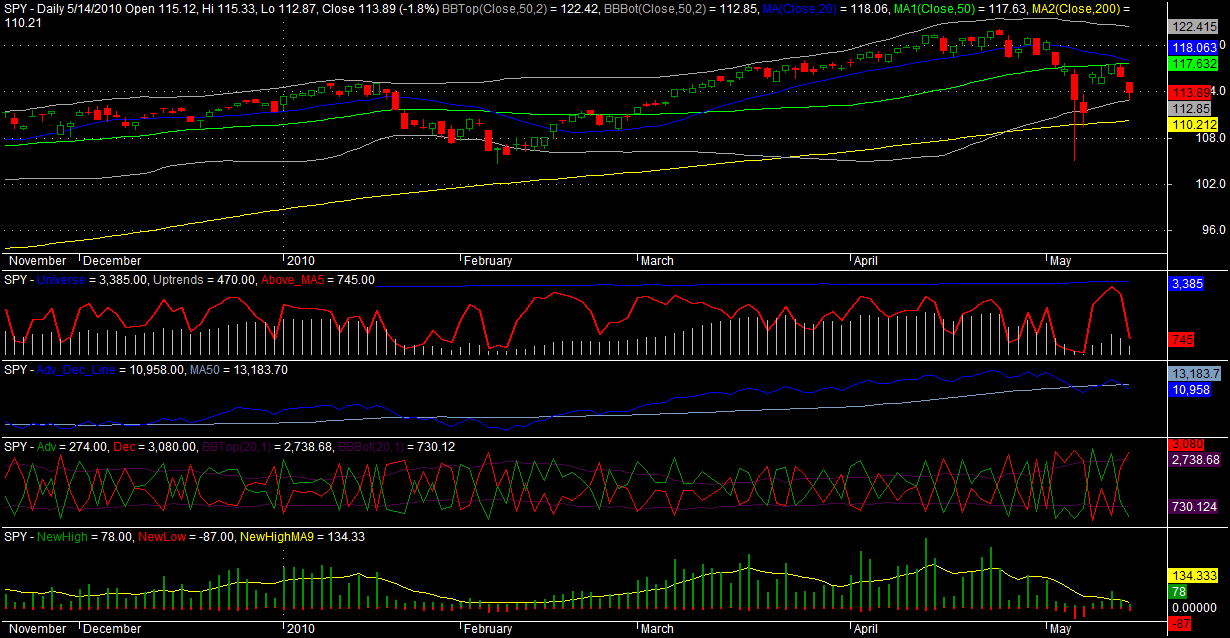
Breadth deteriorated to levels not seen in over 1 year.

Summary:

The gap and break beneath the 200dma was decisive and not to be ignored. Hopefully you have a large cash position by this point.

The breadth readings have deteriorated to levels not seen for over a year. This is not good folks. According to breadth, this rally which began in March, 2009, is over. If we couple these breadth readings with the break beneath the 200dma, we see further evidence that the rally is over.

The good news is that the mean reversion tendency of the market will likely kick in soon, and there will be some consolidation or a bounce. I would use this opportunity to consider some shorts or further reduce long exposure.

Over the next few days, I’ll start dusting off some short setups as I believe it is time.

How To Read the Breadth Report

Universe Screen: Applies to top three indicators. Does not apply to 52 week new highs and lows.

  • The universe contains any stock trading on average more than 100,000 shares per day with a liquidity of  at least $1,000,000  per day, over the last 50 days.

1. Top most indicator is the measure of stocks in an uptrend (gray histogram) and the number of stocks trading above their 5 day simple moving averages (red line).

  • Buy signal is generated for the open when the SPX is above its 200dsma and the red line crosses beneath 700.
  • Sell signal is generated for the close when the red line crosses above 2500, or the trade is held for 25 days.
  • Short signal is generated for the open when the SPX is trading beneath its 200dsma and the red line crosses above 2500.
  • Cover signal is generated for the close when the red line crosses beneath 700, or the trade is held 25 days.
  • Long trade lasts on average 24 days while short sell lasts on average 10 days.

2. The 2nd indicator is the Advance-Decline line (blue line) with a 50dsma plotted (gray line). My calculation is similar but not the same as Investopedia’s.

  • Buy signal is generated for the next open when the SPX is above its 200dsma and the A-D line crosses beneath the 50 day average.
  • Sell signal is generated for the close when the A-D line crosses back above the 50 day average.
  • The average trade lasts about 15 days.

3. The 3rd indicator is the raw advancers and decliners, with the advancers being the green line and the decliners being the red line. There are also Bollinger Bands (purple) set 1 standard deviation beyond the 20 day average of decliners.

  • Buy signal is generated for the next open after the decliners exceed the upper Bollinger Band.
  • Sell signal is generated for the close when the decliners close beneath the lower Bollinger Band.
  • The average trade lasts 5 days.

4. The bottom indicator is the measure of 52 week new highs new lows (histogram), with a 9dsma (yellow line) plotted over top.

  • Buy signal is generated for the next open after the number of new lows exceeds the number of new highs.
  • Sell signal is generated for the close when the number of new highs surpass the 9dsma.
  • The average trade lasts 3 days.

Comments »

The Power Dip is Buying This Dip

PDS has kept subscribers from establishing new long positions from May 11th-May17th.

It has been rather comforting not participating in the angst and hand-wringing that I have been seeing from some nervous longs. The system did select 1 stock for today, Overstock.com, Inc. [[OSTK]] which according to my account is showing a 2.97% profit for the day.

The system has selected 4 stocks for tomorrow. There are some beautiful pullbacks represented, and I am feeling good about buying into these oversold conditions.

I will soon post equity curves for the system since inception as well as answer some reoccurring questions.

As always, the trial is free.

Comments »

Wednesday’s Breadth Report

Breadth deteriorated with price.

Summary:

There won’t be much of a summary tonight as not much has changed with breadth. It is deteriorating with price. The big news is today’s test of the 200 day moving average. EVERYBODY watches the 200dma, and despite what you might have heard, for the broader markets, it is an effective demarcation of bull and bear markets. The 200dma must be maintained, but I would not be surprised to see a close or two beneath it, a shake-out of sorts, before regaining it.

I missed posting yesterday’s Breadth Report. There was a buy signal given for today based on the Number of Stocks Above Their 5 Day Moving Average indicator. The Breadth Report is now 100% long. The Raw Advancers and Decliners gave another buy signal for today as well, but since we are already long from a couple of days ago, we won’t track the signal.

I’m expecting a bounce or attempted bounce over the next few days.  It will be important to watch how breadth responds to any bounce.

How To Read the Breadth Report

Universe Screen: Applies to top three indicators. Does not apply to 52 week new highs and lows.

  • The universe contains any stock trading on average more than 100,000 shares per day with a liquidity of  at least $1,000,000  per day, over the last 50 days.

1. Top most indicator is the measure of stocks in an uptrend (gray histogram) and the number of stocks trading above their 5 day simple moving averages (red line).

  • Buy signal is generated for the open when the SPX is above its 200dsma and the red line crosses beneath 700.
  • Sell signal is generated for the close when the red line crosses above 2500, or the trade is held for 25 days.
  • Short signal is generated for the open when the SPX is trading beneath its 200dsma and the red line crosses above 2500.
  • Cover signal is generated for the close when the red line crosses beneath 700, or the trade is held 25 days.
  • Long trade lasts on average 24 days while short sell lasts on average 10 days.

2. The 2nd indicator is the Advance-Decline line (blue line) with a 50dsma plotted (gray line). My calculation is similar but not the same as Investopedia’s.

  • Buy signal is generated for the next open when the SPX is above its 200dsma and the A-D line crosses beneath the 50 day average.
  • Sell signal is generated for the close when the A-D line crosses back above the 50 day average.
  • The average trade lasts about 15 days.

3. The 3rd indicator is the raw advancers and decliners, with the advancers being the green line and the decliners being the red line. There are also Bollinger Bands (purple) set 1 standard deviation beyond the 20 day average of decliners.

  • Buy signal is generated for the next open after the decliners exceed the upper Bollinger Band.
  • Sell signal is generated for the close when the decliners close beneath the lower Bollinger Band.
  • The average trade lasts 5 days.

4. The bottom indicator is the measure of 52 week new highs new lows (histogram), with a 9dsma (yellow line) plotted over top.

  • Buy signal is generated for the next open after the number of new lows exceeds the number of new highs.
  • Sell signal is generated for the close when the number of new highs surpass the 9dsma.
  • The average trade lasts 3 days.

Comments »

Monday’s Breadth Report

Breadth stagnated while price staged a late-day comeback.

Summary:

Not much changed with breadth on Monday. The indicator showing the greatest change over Friday’s readings was the measure of Raw Advancers and Decliners.

I extended the graph out to cover an entire year. The graph shows that even when breadth is stagnating with not much expansion the markets have managed to stage impressive rallies. This, in my opinion, speaks to the mean reverting environment that has characterized the last 10 years of trading.

As long as we stay above the 200 day average, we should be looking long, although I am still advocating some caution as we have watched a failed retest of the 50 day average.

As of Monday morning, the system is 75% long.

How To Read the Breadth Report

Universe Screen: Applies to top three indicators. Does not apply to 52 week new highs and lows.

  • The universe contains any stock trading on average more than 100,000 shares per day with a liquidity of  at least $1,000,000  per day, over the last 50 days.

1. Top most indicator is the measure of stocks in an uptrend (gray histogram) and the number of stocks trading above their 5 day simple moving averages (red line).

  • Buy signal is generated for the open when the SPX is above its 200dsma and the red line crosses beneath 700.
  • Sell signal is generated for the close when the red line crosses above 2500, or the trade is held for 25 days.
  • Short signal is generated for the open when the SPX is trading beneath its 200dsma and the red line crosses above 2500.
  • Cover signal is generated for the close when the red line crosses beneath 700, or the trade is held 25 days.
  • Long trade lasts on average 24 days while short sell lasts on average 10 days.

2. The 2nd indicator is the Advance-Decline line (blue line) with a 50dsma plotted (gray line). My calculation is similar but not the same as Investopedia’s.

  • Buy signal is generated for the next open when the SPX is above its 200dsma and the A-D line crosses beneath the 50 day average.
  • Sell signal is generated for the close when the A-D line crosses back above the 50 day average.
  • The average trade lasts about 15 days.

3. The 3rd indicator is the raw advancers and decliners, with the advancers being the green line and the decliners being the red line. There are also Bollinger Bands (purple) set 1 standard deviation beyond the 20 day average of decliners.

  • Buy signal is generated for the next open after the decliners exceed the upper Bollinger Band.
  • Sell signal is generated for the close when the decliners close beneath the lower Bollinger Band.
  • The average trade lasts 5 days.

4. The bottom indicator is the measure of 52 week new highs new lows (histogram), with a 9dsma (yellow line) plotted over top.

  • Buy signal is generated for the next open after the number of new lows exceeds the number of new highs.
  • Sell signal is generated for the close when the number of new highs surpass the 9dsma.
  • The average trade lasts 3 days.

Comments »

Revisting the 20 and 50 Day Average Bearish Crossover

I was just over at our newest blogger’s site, chessNwine, checking out his stellar charting skills. He made a remark about the impending 20 day average cross beneath the 50 day average on the SPX, which reminded me of some recent testing I did on this cross, which is widely considered to be bearish. My testing shows that it is actually not as bearish as one might think, and it might even make a decent buy signal.

Considering that February’s cross marked the low almost to the day, the results in my testing which did not include February’s cross, would be even more bullish.

You can decide for yourself:

20 Day and 50 Day Cross: Time to Short?

Comments »

Weekend Breadth Report- 3 Indicators Giving Buy Signals

Breadth deteriorated with price causing 3 of 4 indicators to give buy signals.

Summary:

My cautious stance, derived from the Breadth Report readings, paid off as I was largely out of the market for the recent pullback. While breadth is not strong and is deteriorating, 3 of 4 indicators are giving buy signals, with the 4th indicator very close to giving a buy signal. Perhaps another bounce is due.

Caution is warranted anytime we are trading beneath the 50 day moving average. The number of stocks in an uptrend (gray histogram) has deteriorated to a level that is consistent with a correction. We want to see this histogram strengthen before removing a cautious stance. Lucky for the bulls, we are barely above the 200 day moving average. As long as we hold this average, the Number of Stocks above the 5DMA indicator and the Advance Decline Line indicator will keep giving buy signals. Closing beneath the 200 day moving average, and then a retest and fail to re-take the average will mean we move into short mode.

Buy Signals for Monday Morning:

1. Advance Decline line

2. Raw Advancers and Decliners

3. 52 Week New High and New Lows

How To Read the Breadth Report

Universe Screen: Applies to top three indicators. Does not apply to 52 week new highs and lows.

  • The universe contains any stock trading on average more than 100,000 shares per day with a liquidity of  at least $1,000,000  per day, over the last 50 days.

1. Top most indicator is the measure of stocks in an uptrend (gray histogram) and the number of stocks trading above their 5 day simple moving averages (red line).

  • Buy signal is generated for the open when the SPX is above its 200dsma and the red line crosses beneath 700.
  • Sell signal is generated for the close when the red line crosses above 2500, or the trade is held for 25 days.
  • Short signal is generated for the open when the SPX is trading beneath its 200dsma and the red line crosses above 2500.
  • Cover signal is generated for the close when the red line crosses beneath 700, or the trade is held 25 days.
  • Long trade lasts on average 24 days while short sell lasts on average 10 days.

2. The 2nd indicator is the Advance-Decline line (blue line) with a 50dsma plotted (gray line). My calculation is similar but not the same as Investopedia’s.

  • Buy signal is generated for the next open when the SPX is above its 200dsma and the A-D line crosses beneath the 50 day average.
  • Sell signal is generated for the close when the A-D line crosses back above the 50 day average.
  • The average trade lasts about 15 days.

3. The 3rd indicator is the raw advancers and decliners, with the advancers being the green line and the decliners being the red line. There are also Bollinger Bands (purple) set 1 standard deviation beyond the 20 day average of decliners.

  • Buy signal is generated for the next open after the decliners exceed the upper Bollinger Band.
  • Sell signal is generated for the close when the decliners close beneath the lower Bollinger Band.
  • The average trade lasts 5 days.

4. The bottom indicator is the measure of 52 week new highs new lows (histogram), with a 9dsma (yellow line) plotted over top.

  • Buy signal is generated for the next open after the number of new lows exceeds the number of new highs.
  • Sell signal is generated for the close when the number of new highs surpass the 9dsma.
  • The average trade lasts 3 days.

Comments »

Power Dip System: April Performance- Updated

The Power Dip System had a great month in April, trouncing the indexes.

As always,  The Power Dip System trial is free, and does not require anything more than an email address to sign up.


Equity Curve: 1% Risk, 10% Stop

Equity Curve: 2% Risk, 10% Stop

Equity Curve: 2% Risk, 3ATR Position Sizing/Stop

The stats and equity curves show that position-sizing based on the volatility of each stock is still superior to fixed position-sizing and stops. Even doubling risk from 1% to 2% is not working nearly as well as using volatility-based position-sizing.

If you have any questions about the Power Dip System, feel free to leave me a comment.

Comments »