*Based on some comments, I have updated the post. Updates are at the end of the post.
I truly love these posts that challenge conventional wisdom. I mean everyone knows that closing beneath the 200 day moving average is like super duper super squared bearish, right?
Today $SPY closed beneath its 200 day moving average for the first time since June. What happens when one buys the $SPY after such an event?
The Rules:
Buy $SPY (or $SPX) at the close if
- Yesterday $SPY ($SPX) closed above the 200 day moving average
- Today $SPY ($SPX) closed below the 200 day moving average
All $SPY history used. $SPX history goes back to 1928. No commissions or slippage included.
The Results:

Over the last 20 years or so, this has been a trade that almost doubles expected $SPY buy-n-hold performance over any average 50 day period. The first $SPY trade for this setup occurred in 1994.
On the other hand, going back to 1928 and using $SPX to buy and sell (which can’t happen in real life, but it does give us lots of history to play with), this has been a trade that almost halves the expected $SPY buy-n-hold performance over any average 50 day period.
So recently this setup has worked well but over the past century, not so well.
How do we square these results with last night’s results? I’m not sure, but I have some ideas. I’d be curious to hear your ideas in the comments section.
Related Posts:
S&P 500 In Bad Position, Relative to the 200 Day Moving Average
Fade the Bears and the 200 Day Average
UPDATES:
I’m going to focus on the more recent trades (over the last 20 years) which used $SPY.
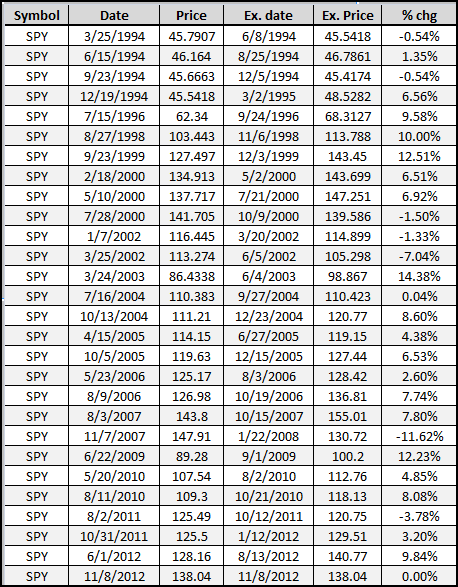
$SPX is used to determine all signals. If $SPX closes beneath the 200 day moving average, then $SPY is purchased. Davey Jones asked how many times this has occurred. There are a couple ways to answer that. One way is to just give raw signals, meaning how many times has the setup occurred? The setup has occurred 73 times. However, if trades are taken and held for 50 days, then that number decreases to 28.
As for the outliers and the median return, I’m just going to post the trade-by-trades as I think that being able to see the actual trades is the most helpful.
I asked in the post, how do we square the results of this bullish study against the somewhat bearish study posted the night before? After doing some poking around, I believe that the two bear markets over the past 10 years have skewed results. In those bear markets, $SPY would often hover just above the lower Bollinger Band (50,2) and then resume the slide down the band as the bear market endured. Thus, any close near the lower BB meant that it was likely that the market was still trending downward.
If there is anything I have missed, let me know in the comments section.


Put up a graph with the median return, too, so I can see how skewed the results are.
*Please* put up a graph…
Nice to see you back doing these studies… second the request for some sort of exposition of the outliers…
No problem. I’ll update this evening.
How many times has this occurred? How about just in secular bear markets? Thx
Just looking at the graphs my initial intuition is that the returns following a close below the 200DMA are statistically significant, while those following the BB setup are not. A quick look at the data shows this to be the case: http://qusma.com/wp-content/uploads/2012/11/200dma-vs-lower-bb-reversion1.png (I wasn’t able to perfectly replicate your results, perhaps you include dividends…not sure what the cause of the differences are, but it’s close enough anyway).
So, we square those results by virtue of one being noise and the other not.
Finally, short-term mean reversion has only been working well since 1987 on the S&P, so this sort of medium-term reversion signal looking worse by including more data isn’t particularly surprising.
Great comment. Thanks! There are actually more samples to work with from the BB setup vs. the 200DMA setup, but I don’t doubt your work. Also, agreed about mean-reversion. Will have to come back this evening to put down some more thoughts. Late for work!
Great stuff, Wood.
Thanks Chess…
“After doing some poking around, I believe that the two bear markets over the past 10 years have skewed results.”
Good observation, and I will second this. Some of the most time-consuming, mind-numbing work to do after building a trading system, but I have found sometimes very rewarding, is to go back over the trades one by one to see what the context was. Are the conditions typical and likely to reoccur, or was there an extraordinary environment?
I’ll add something else I look for – does a one day change in a trade make a big difference, as in 5%+? If so, don’t expect that to repeat, good or bad.