Approximately 2 weeks ago I posted about the bottom signal that was developing, signified by the historic lows of the percentages of stocks above their 20 and 50 day moving averages. Shortly thereafter, a bounce was made, and then more downside action followed.
Click on the chart to enlarge…
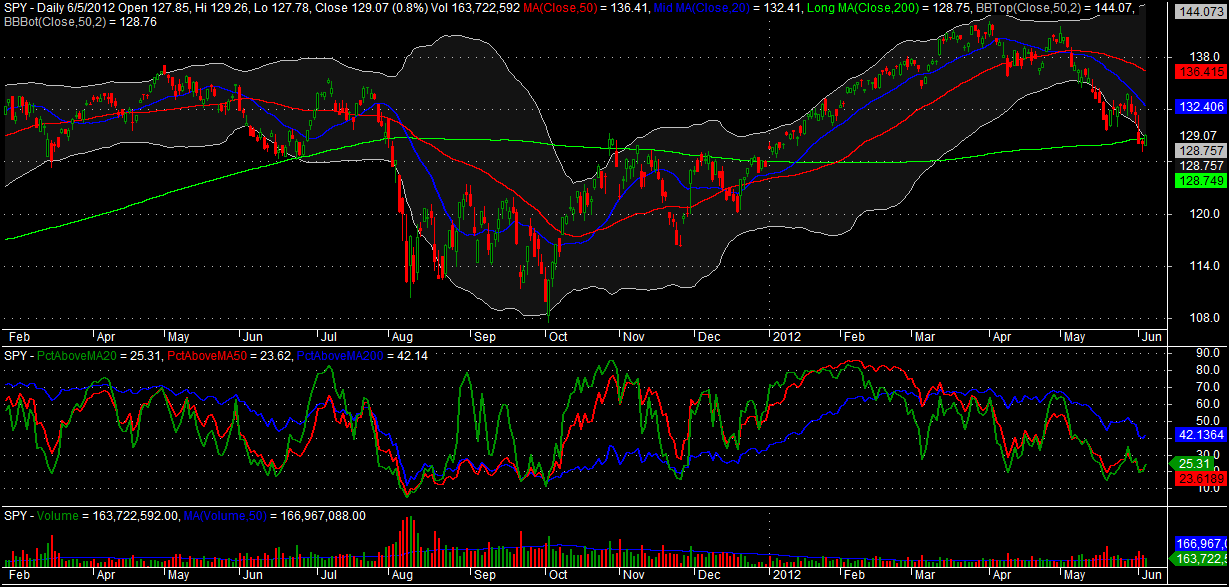
I have updated the graph, and as you can see, there is a divergence occurring. Note the percentage of stocks above their 20 and 50 day averages (green and red lines )has climbed while SPY has fallen.
Some of you noted in the previous post that after a historic low was made, the market had the tendency to fall a bit more or consolidate before beginning a new uptrend. While the market continued to fall or consolidate, breadth, as measured by the percentage of stocks above the 20 and 50 day averages, tended to have already bottomed. It appears the same progression is now occurring. Check the previous post to see a longer-term view of the graph.
I believe the divergence signifies we have better than average chances of a significant bottom developing here.
I should note that I had written the bulk of this post last night, to be published today, and had no way of knowing that we would get a huge bounce today.


