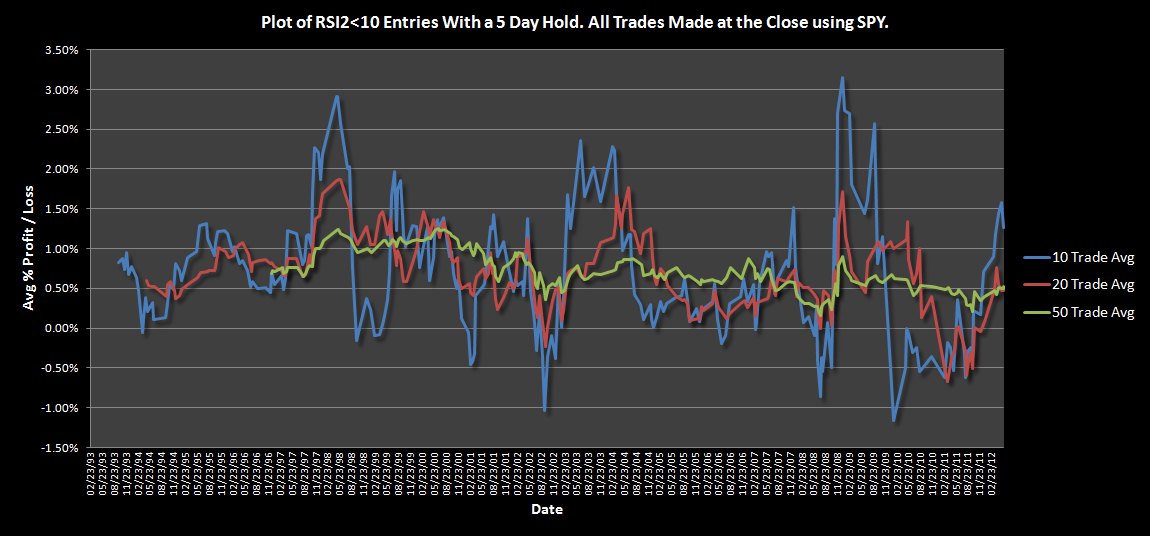
This post demonstrates historical performance generated from buying IWM anytime its RSI2<10 and holding the trade for 5 days. Also included are the previously published graphs of SPY and QQQ, for the sake of comparison.
Click on the graphs to enlarge…
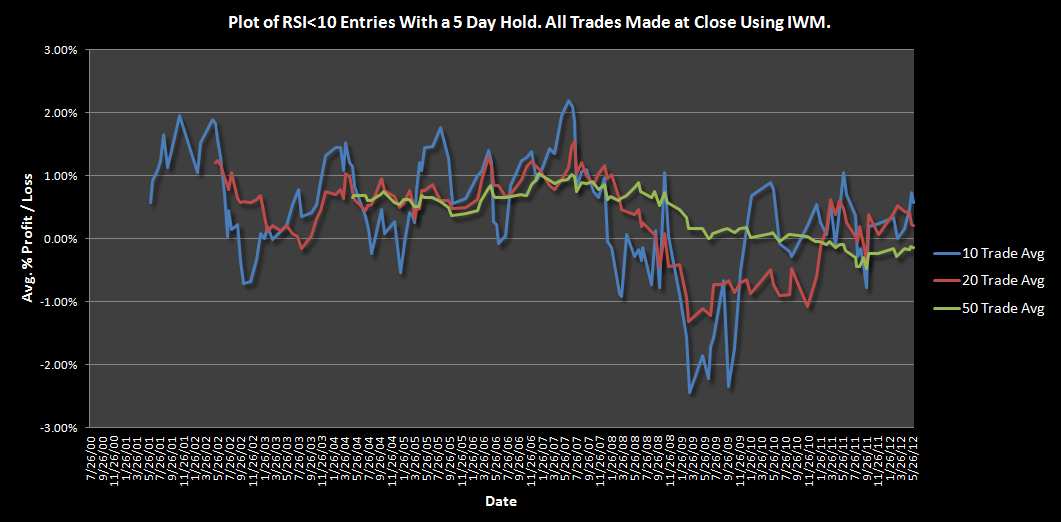
I have created a rolling 10, 20, and 50 trade average and plotted them according to the dates each trade was closed.
Until 2007, this setup worked well using IWM. The rolling averages were above 0.0% most of the time. That all changed after the bear market of 2008.
Let’s compare IWM to SPY and QQQ.
SPY Graph:
QQQ Graph:

These graphs demonstrate that SPY is the only ETF of the three that isn’t showing a breakdown when using RSI2<10 to initiate short-term swing trades. QQQ should not even be considered while IWM has suffered since the 2008 bear market.
For these reasons, future RSI2 tests will focus on SPY. The next round of tests will examine various exit strategies. I seek to determine if there is any particular RSI2 strategy that has not shown signs of breaking down.


I read somewhere of a back test showing a good rsi2 method was buy below 5 and sell above 70. Maybe this article.
Yeah, that works, but it doesn’t trade very often for indexes like SPY. It might work well on individual stocks with some sort of trend filter.
Or individual sectors or commodities (more volatility than SPY perhaps). I will try it and post results in the BN (after I sell some stuff first).