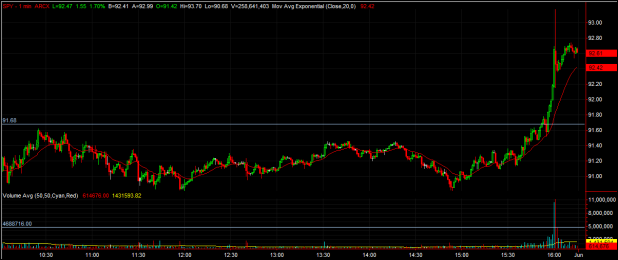
I have not read much discussion on the surge of buying into Friday’s close. I think it is signficant not only due to the surge of volume and rate of change, but because it sets the S&P 500 to challenge the 200 day moving average.
The chart above is a 1-minute bar of the SPY on Friday, 5/29/09. The chart begins just after the open, where the high was set at $91.68, shown by the upper horizontal line. The last four minutes of the chart shows the surge above the intraday high. The lower horizontal line shows the intraday high for volume, which was doubled in the last minute of trading.
I have read rumors of buying in the pit of almost $600 million in S&P futures, in the last minutes of trading. On an afternoon with little news to speak of, speculating on the motive behind such a large purchase (SPY moved over 1% in a few minutes) in a short period of time can be a fun exercise, but is probably of little true value. I find I enjoy the speculating anyway.
I have two separate platforms that show the SPY 200 day average at $93.03, while StockCharts shows the 200DMA as $92.05. Perhaps another bullish conspiracy? Kidding, of course. StockCharts does show the underlying SPY index, SPX, as being beneath the 200DMA. Any trader using only StockCharts data sees a close above the 200DMA on the SPY, which is a significant technical event.
As I type, the S&P E-mini futures are trading at 924.50 with the 200DMA at 928.59. Looks like the next test of the 200DMA may happen overnight. Monday is setting up to be a pivotal day.


SPX broke through 200DMA around 2:15a.m eastern time.
http://market-ticker.denninger.net/archives/1072-What-Was-THAT-Friday-Market-Close.html
Juice, thanks. I was sure someone had covered this, but I don’t often read Denninger.
KD is pretty much a broken record when he isn’t dressing up in goofy suits, combing his hair and making an arsetard out of himself on youtube.
http://zerohedge.blogspot.com/2009/05/goldman-sachs-principal-transactions_29.html has a much more interesting take on the situation since he’s been following the programing trading that he has fingered as being a likely culprit for current market.
If it’s true that the markets are being moved by the Agents, Matrix-like then it should be far simpler to use stat analysis to game the system.
From my own perspective – I saw a huge shift in Feb when I stopped using GA analysis. All of the GA signals shifted en masse to a point of uselessness sometime mid Feb. I haven’t gone back and looked at them essentially because the regime shifted to something other than a short term mean reversion.
Putting on my tinfoil hat, I wonder if it’s some huge sort of bull trap for the program trading – with the SPX over 200MA it would look a little weird if there wasn’t a huge surge in buying this week.
My $.02
As for the 200 DMA discrepency, probably has to do with adjustments for distributions. StockCharts is pretty good about adjusting past prices for distributions (dividends, cap gains, etc.). TradeStation, for example, explicitly does not adjust past prices, so it will show a higher value for past prices than SC. SPY has a ~3% current yield; average that over 200 days and it looks close to the 1% discrepency.
You know, the more I think about it – I wonder if it was a huge bet by someone that the response of the GM bankruptcy would be bullish?
It worked well that the DJIA decided to replace Citi & GM today as well but, that’s beside the point – who could have known that on Friday?
Notes on SPY between .99% and 1.039% of 200MA (taken from my spreadsheet so a more formal app might yield different results).
I thought I would count the number of days that SPY oscillates in the murky waters between .99 and 1.04 of the 200MA as it seemed ripe for some sideways action:
Sample Range: 11/11/1993 – 5/25/2009
Total Incident Count: 66
Average: 8.54 days
Standard deviation: 10.56 days
Median: 4 days
One of the major flaws was that I didn’t split the sample up between coming to the 200MA from below and above but, my thinking is that there may be different kinds of price action depending on the general trend of SPY.
Good points Toptick. Keep in mind though that another data vendor has the same 200dma as Tradestation (which uses a separate data vendor).
NEVER use technicals on the last day of trading in May. That’s the annual Russell Index determination day. Stocks are gamed into close to attempt to move names into and out of a myriad of Russell indices.
http://www.russell.com/indexes/membership/reconstitution/default.asp