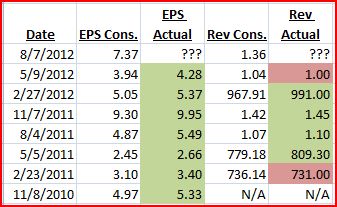
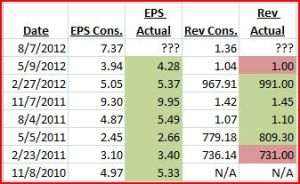
Priceline reports 8/7 after market. Looking at prior 7 earnings we can see that PCLN has a history of beating EPS and revenue with the 2 revenue misses being narrowly missed compared to the beats verse the consensus.
Competitors TRIP and EXPE have already reported with both moving in opposite directions (EXPE up and TRIP down). Both companies were cautious going forward marking weakness in Europe. Along with mostly beating expectations, PCLN has had a history of raising or maintaining guidance so if they cite weakness and lower guidance I believe shares will take a sizeable hit.
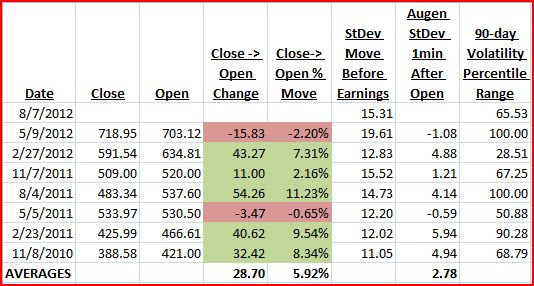
The next table shows the moves after earnings with other data I use to look forward for an expected move.
![]()
From this data I like to take the average Augen StDev move (1min after the open after earnings release) and multiply it times the StDev move before earnings. In this case:
- 2.78 * 15.31 = 42.56 is my expected point move based on prior price action and volatility movements into earnings and this is what I will use to structure an options trade (preferred being verticals, butterflies, iron condors, and ratio spreads).
Also looking at this, we have some higher Augen StDev moves as high as 5.94 and mostly above 4. I will use this to measure some extreme moves:
- 5 (splitting between 5 & 6) * 15.31 = 76.55
This would be an extreme move representing a 11.5% move which would trump any other move with only one being close (8/4/2011 saw 11.23% move). But as stated above, if they miss or the forward guidance disappoints then I believe this number is achievable.
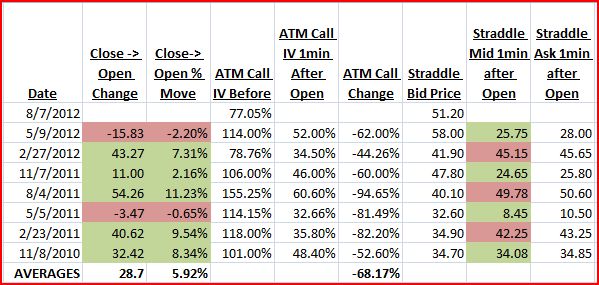
The next table shows implied volatility (IV) moves and looks at the ATM straddle to see what the option market is pricing (I prefer to use the bid for purposes of the worse possible fill). On the far right the green cells represent a win selling the straddle and the red cells represent a loss)
![]()
The above data tells me the following:
- the ATM Call IV into earnings is the lowest we’ve seen (subject to change tomorrow)
- the straddle bid is 2nd highest we’ve seen, implying that the options market is currently pricing in over a $51 dollar move
- there has not been favorability in buying/selling the straddle
- 11/8/2010 straddle sale was a close win with a 8.34% move with ATM volatility at 101%
- 2/27/2012 straddle sale was a loss on a 7.31% move with ATM volatility at 78.76%
- With current ATM at 77.05% I believe selling volatility for a non-directional trade would be disadvantageous, so I will be looking for a directional trade.
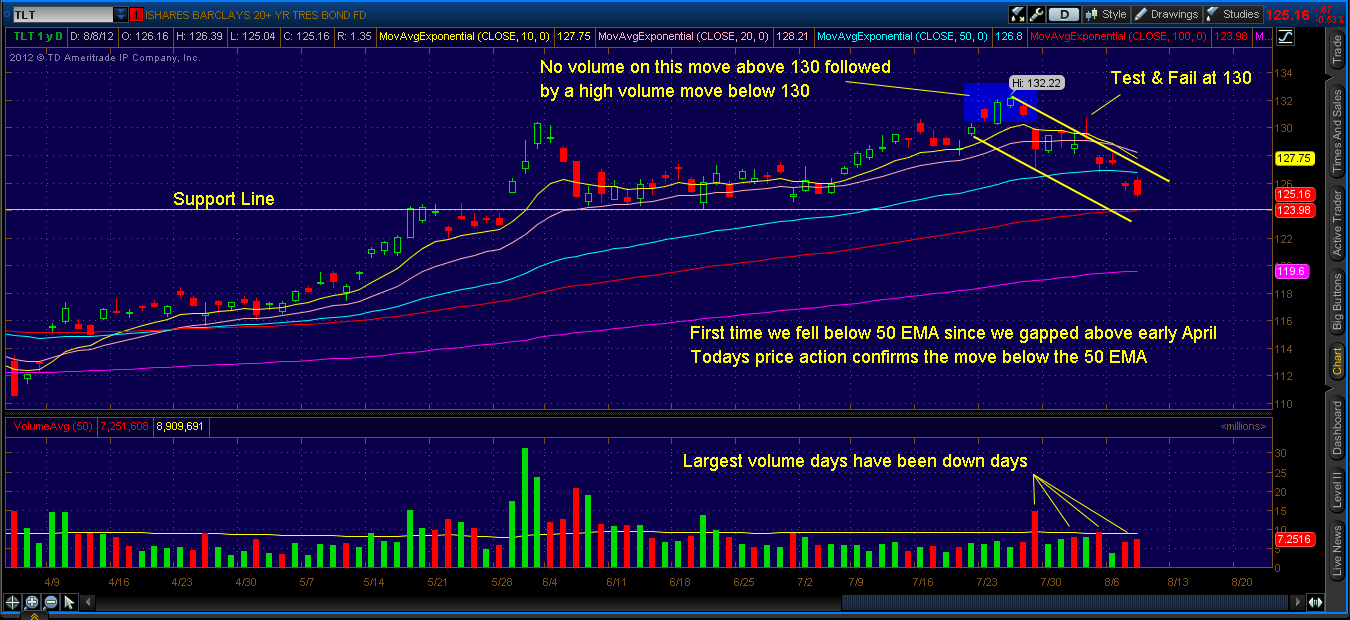
Now I will look at the chart for price targets.
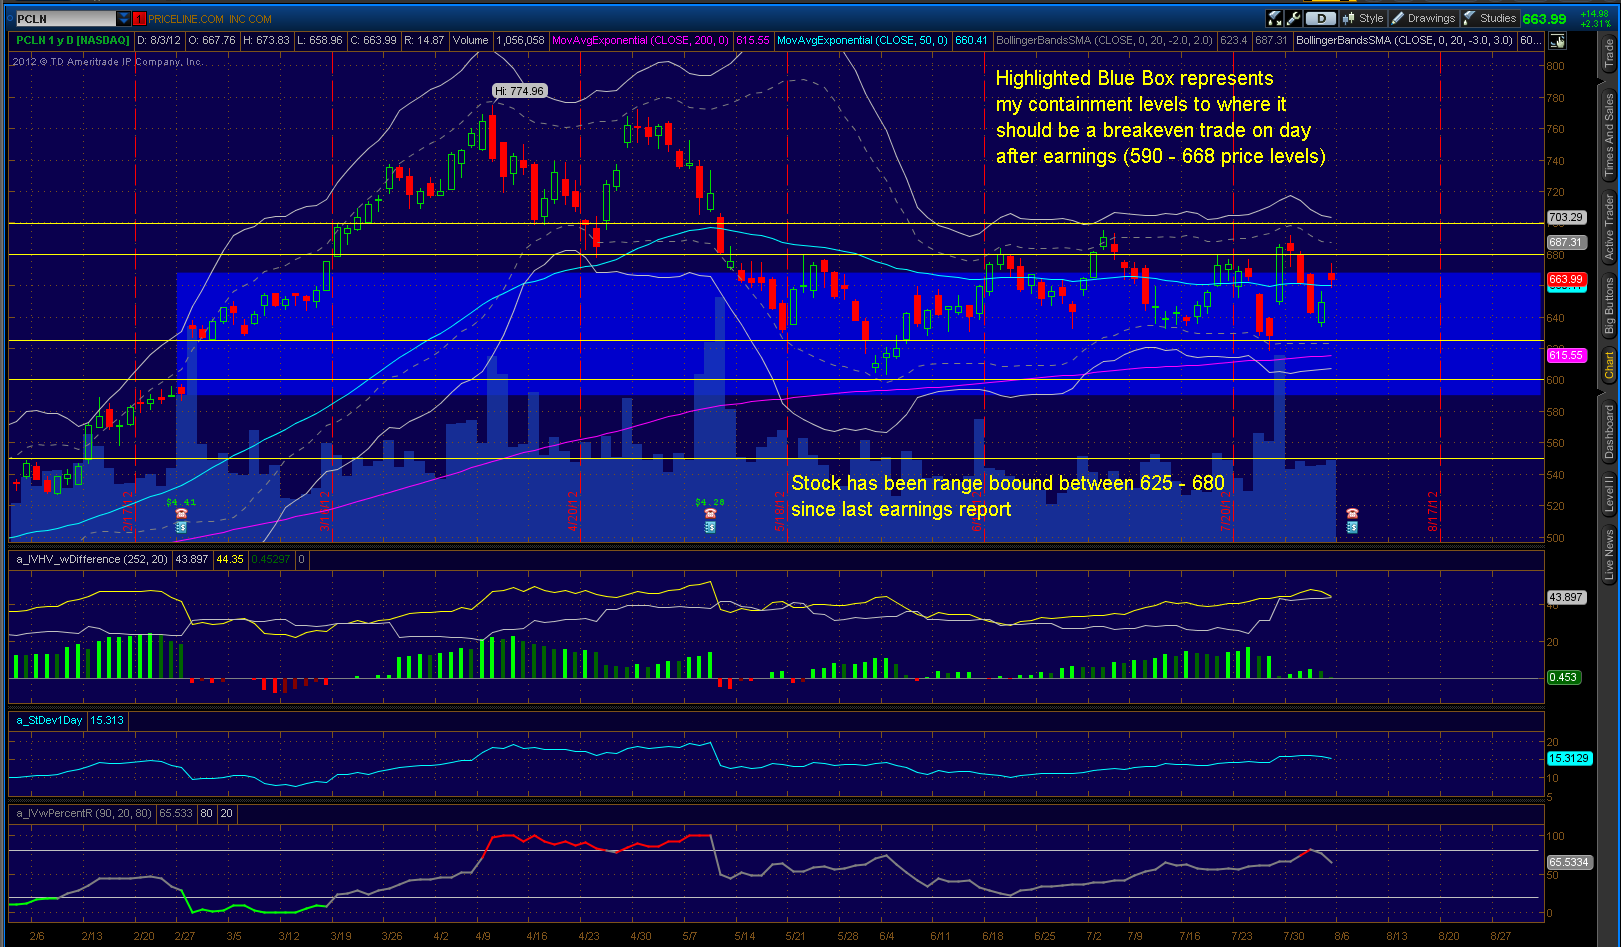
Priceline has some nice whole number support and resistance levels which I have labeled at (note these are general areas and not to the dollar):
- 550 – breakout point from prior range (not shown on chart)
- 600 – gap support area
- 625 – gap from 2/27/2012 earnings, acted as support level
- 680 – resistance area of current range
- 700 – resistance area & where Upper Band of 3rd St Dev Bollinger Band comes in
![]()
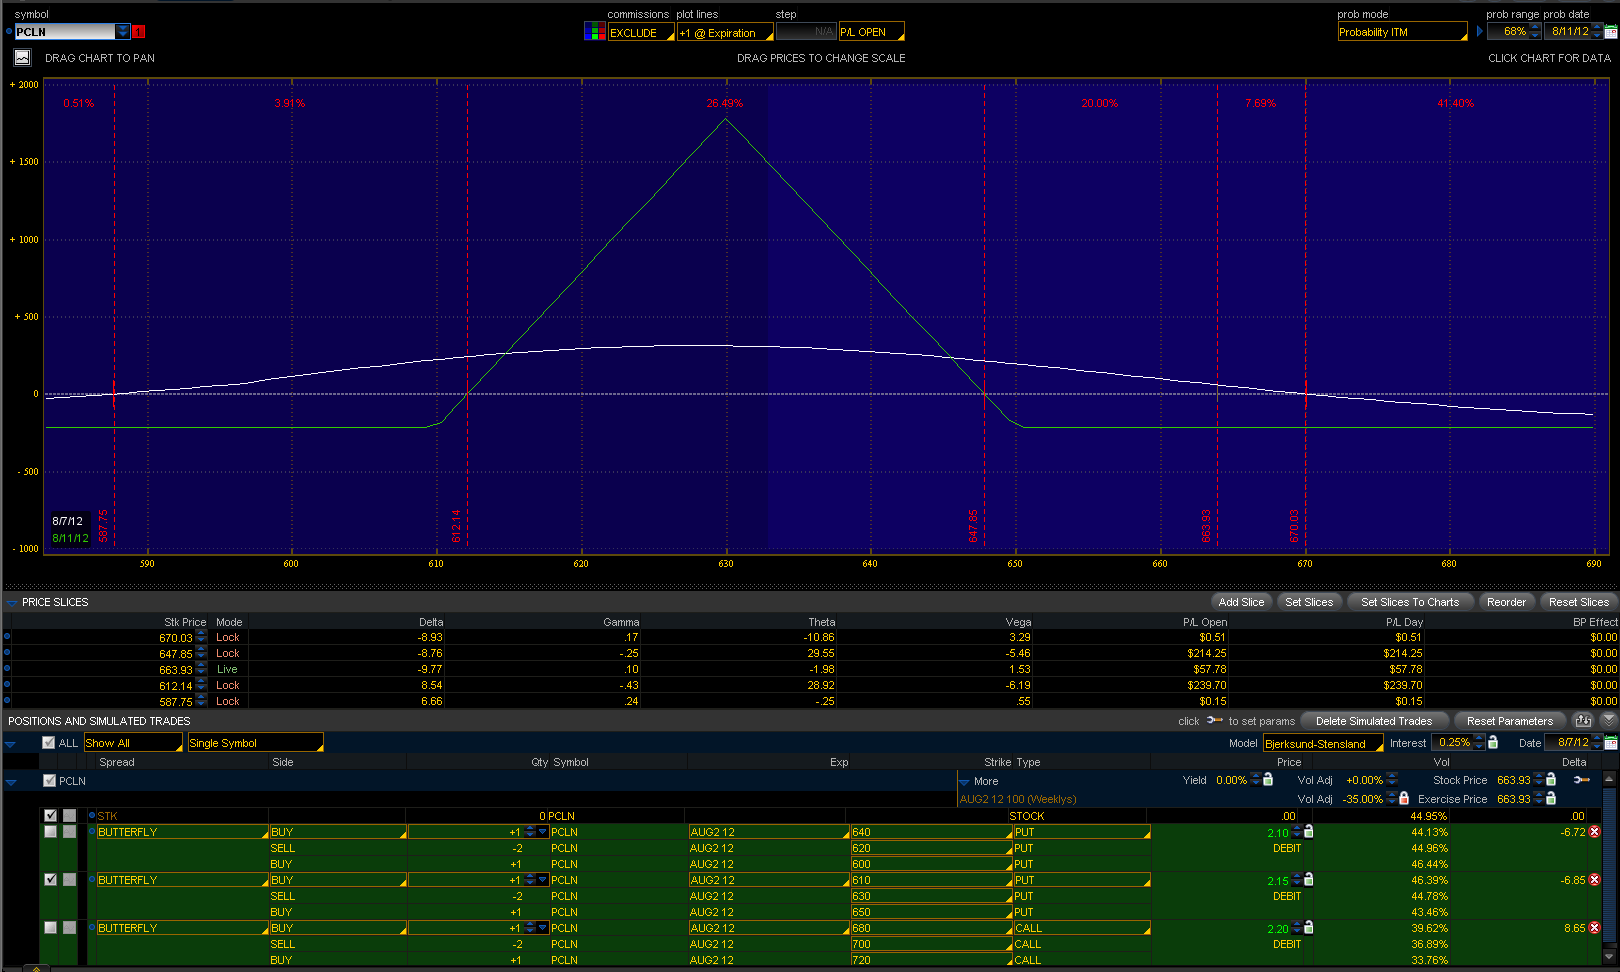
With the information that I have I am looking to take on a directionally bearish position into earnings taking advantage of a volatility drop.
Trade idea: Long the Weekly Aug 610/630/650 Put Butterfly, currently 2.15.
The risk profile below shows the trade after the earnings release with what I believe the trade will look like taking into account time and volatility drop. Even though on average the ATM call has dropped 68.17% (noted above) I chose to use a drop of 35% due to what I noticed in recent trades. When there has been a large move, in this case expected over 40pts, there tends to be a bid in volatility causing it not to drop as much. I tested other dates and the drop was around 30-40%, so I used 35% in this case. Remember this all approximations and what to expect. I also am showing two other butterflies, one 10 points lower and the other an upside with selling the 700 calls (both being 20-wide).
![]()
The price slices show expected breakevens after the release, at expiration, and at current price 663.93.
Note on the price chart the highlighted Blue Box. These are my containment levels after the release to which I believe the trade would still be at breakeven or slightly above after the release and the trade could be taken off or kept depending on intraday price action.
PCLN does have a fairly wide option spread so if you do put this trade on you will have to come of the mid-price more than usual. One technique I like to use with the thinkorswim platform utilizes the hash marks on the order tab. I found if I go to that first hash mark (where blue arrow is pointing) I have a better chance of getting a good fill in a quicker amount of time. In this case instead of getting the trade at 2.15 it would be 2.55, which I would still have no problem entering at.
![]()
All data used comes from StreetInsider.com and features within the thinkorswim platform. Not all data is completely accurate as I sometimes round the IV percentages but nothing to where the results would be extremely skewed. Also all data is used for approximations and nothing is guaranteed. This is to show the reader my personal thought process going into an earnings trade and what I look at and the data I can use to structure a trade. Unfortunately all the time used to structure a trade can still result in a complete loss.
Please note that going into earnings a trade structured like this should be taken only if you are willing to lose 100% of your investment. These trades are considered high risk and should only compromise a small amount of your overall portfolio.