Here are some weekly charts I’ve been looking at. I find the weekly chart can sometimes clear away the trend clutter, even as it may not be as helpful from a day to day perspective. A “rudder” if you will, for your long term portfolio direction.
First our friend SKiFfles [[SKF]] ). (Remember, click on the charts to expand them)
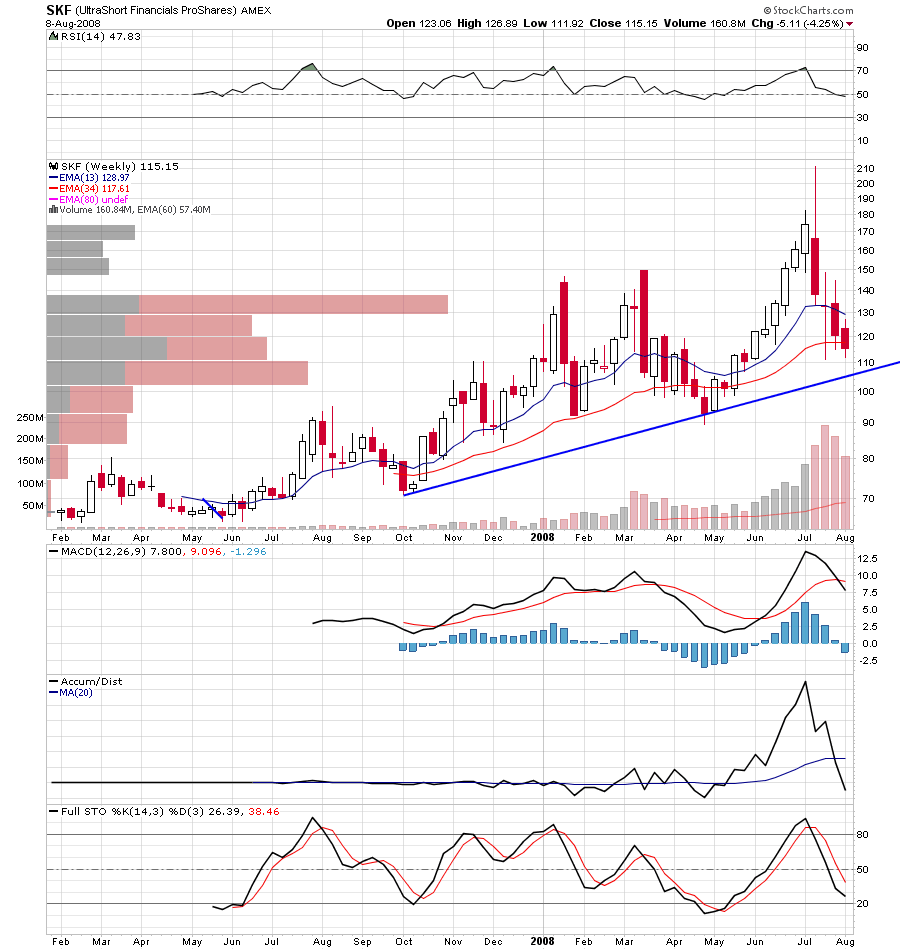
As you can see, our friend is still in the uptrend, despite it’s most recent violent machinations. In fact, it looks like it may have another date with $105 here, heaven help us. Those volume bars are scary too, but as this is a relatively young ETF, I think increasing volume reflects it’s higher profile as a hedging device.
Next up is Las Vegas Sands Corp. [[LVS]] , which has boomeranged into a sharp “V” bounce in the weeklies, but to what end? :
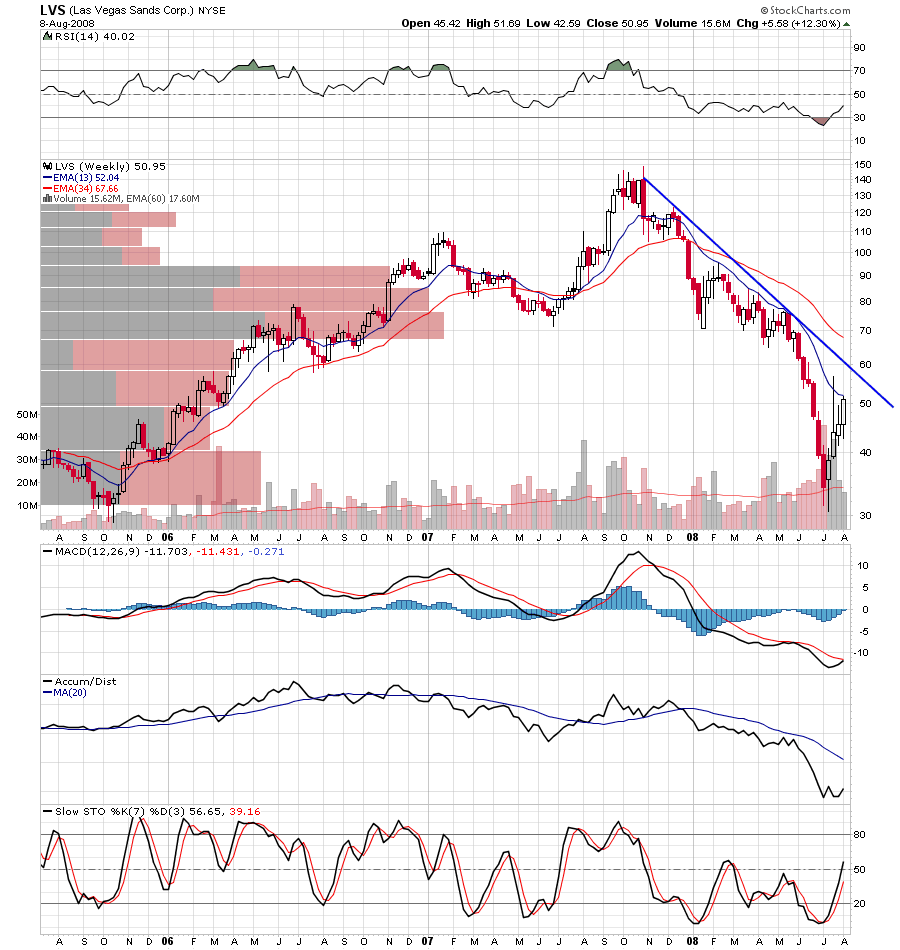
This chart reminds me of a few of those “pre-rescue” bank charts, especially w. regard to the clear indication where to short. The trend line is your friend here.
Last we have newly cracking The Mosaic Company [[MOS]] .
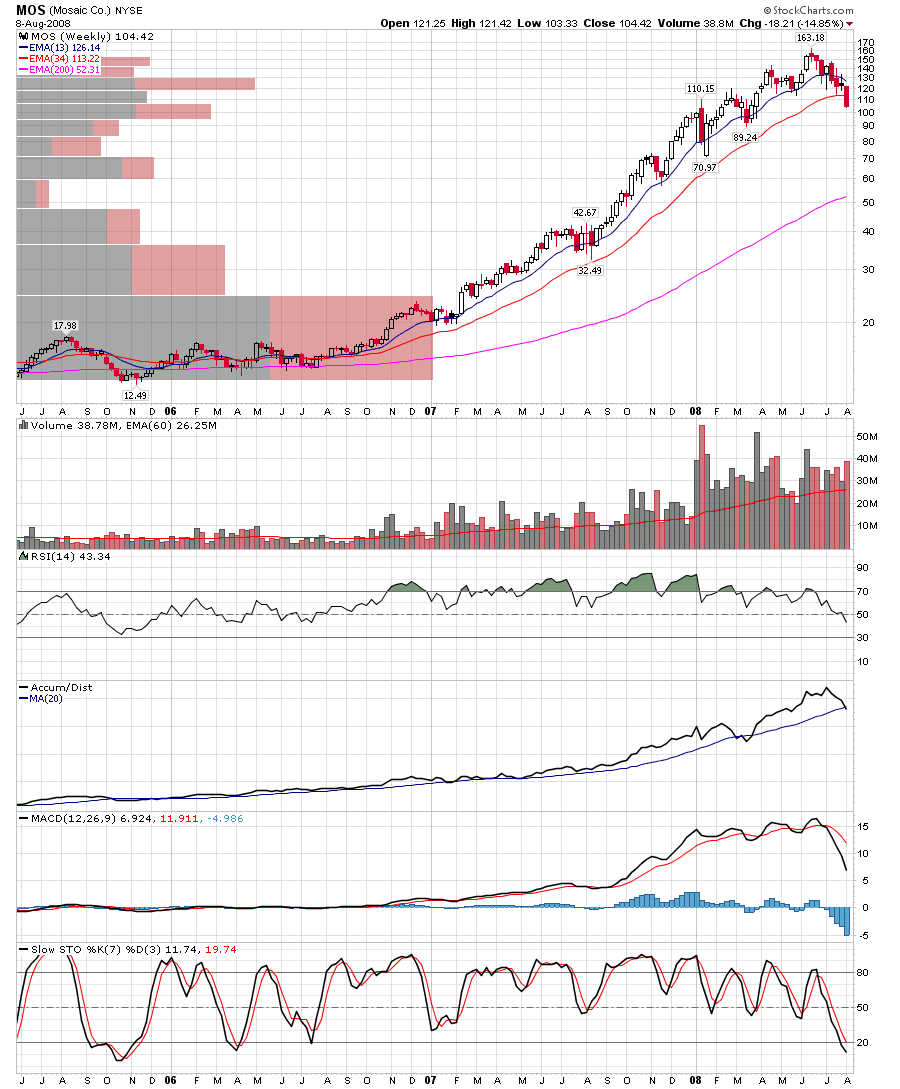
While the 13 week moving average has not yet cut through the 34 week moving average to form the traditional “death cross” short signal, we note with some interest that we’ve finally broken under the 34 week moving average for the first time since July of 2006. This could very well mark the beginning of the end for MOS, and for all the ag stocks, which are all beginning to take on similar characteristics.
If you enjoy the content at iBankCoin, please follow us on Twitter


Good stuff Jake. I like to look at the weekly charts for the long term trend too.