Not so bright, but a good guy to have around when the Fox is in the hen house! (No really, that’s a metaphor… really!)
The Amex Gold Bugs Index (AMEX: $HUI) is one of my touchstone index’s for my precious metal portfolio. The $HUI contains mostly unhedged gold mining companies and a couple of crappy silver miners (CDE and HL) , who don’t really serve as good representatives for the silver mining community (unlike Jacksonians SLW, PAAS, and SSRI). Jacksonians Core gold holdings [[EGO]] and IAG are members, however, along with “possible” new entrants GG and AUY. The full fifteen components are listed here.
Because of it’s silver component, I find the $HUI even more useful than the ETF GDX as a precious metal miner index. So let’s have a look at the daily and weekly charts to see where we are:
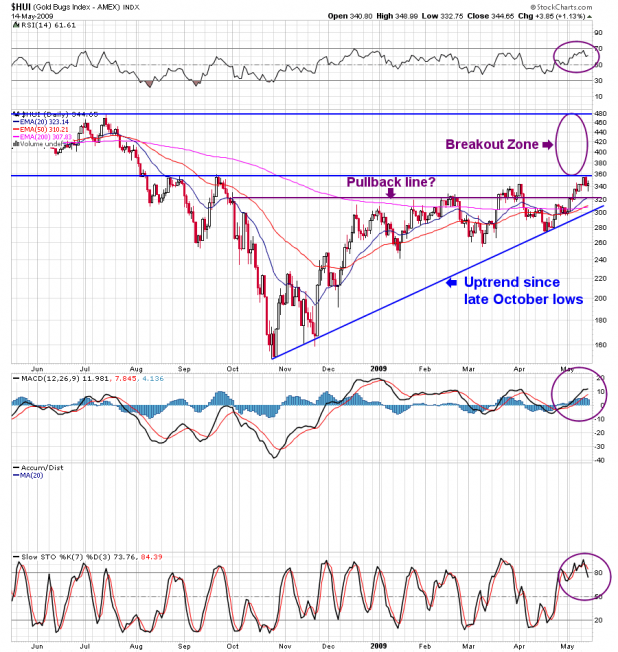
As you can see from the chart, the current daily is showing signs of a pullback, likely to the 20-day EMA at $323 to $325. This is perfectly healthy — and in fact welcome — given the recent drive to the long term resistance line pictured. I expect it won’t be long before we are above that line and into the free air described in the “breakout zone.”
As for the weekly:
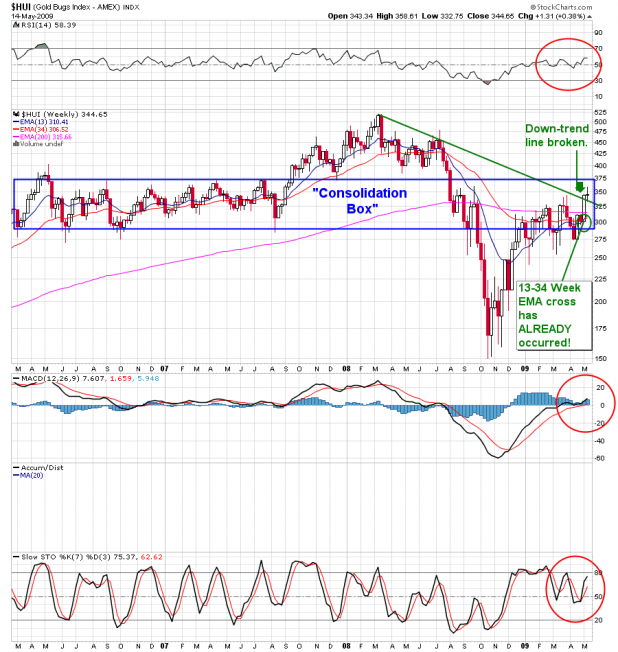
You can see we have broken above the long term downtrend line on the weekly chart, and are also seeing a bullish cross on the 13-34 week EMA’s. The midweek doji indicates we may test lower, but again, it looks like we are headed out of the consolidation zone soon.
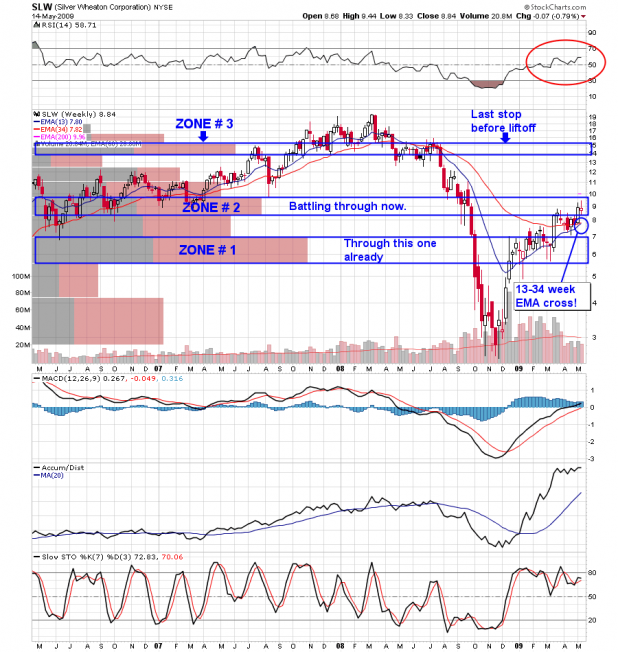
Last, I annotated the long term weekly chart of SLW just for shits and giggles, to show where it is in relation to the $HUI weekly above, and to point out some obvious (from a weekly prospective) target zones. One thing I would point out is the long term fib lines show the 38.2% retracement line at $9.02, which we tested earlier this week. Again, it’s perfectly natural to have the price level turn away at that important point. Given the strength of the $HUI, however, I expect that $9.02 will not hold twice. Viz:
I will try to get back later tonight to update the Jacksonian Core performance stats, but I have to run to pick up one of the boys from lax practice. You know, “the aerobic baseball?”
Best to you all.
_____________
Jacksonian Core’s Performance for 5/14/09 was largely flat, with ten “down” positions keeping their losses in the pennies. On the other hand, of the four stocks in the black today, two —ANDE and TSO– were up over 5%, making it a market neutral day overall.:
ANDE — $20.88 (+5.51%)
GDX — $38.05 (+0.29%)
GLD — $91.03 (-0.07%)
IAG — $9.78 (-0.91%)
PAAS — $19.20 (-0.31%)
RGLD — $40.56 (-0.10%)
SLV — $13.85 (+0.29%)
SLW — $8.84 (-0.11%)
SSRI — $19.89 (-0.22%)
TBT — $48.94(-0.71%)
TC — $7.63 (-0.90%)
TSO — $17.21 (+6.96%)
Have a nice evening, all.
_____________________________
If you enjoy the content at iBankCoin, please follow us on Twitter


noice work … didn’t realize JakeG was quite the chart chompetta extraordinaire 8)
Good stuff Jake. Thanks.
i like my friend huey better. must see end.
http://www.youtube.com/watch?v=TpgH6B62iQw&feature=related
Jake…good stuff as usual..i have been buying SLW like a democrat spending taxpayers money…but ill have something to show at the end…here is a quote from a good china analyst re:molybdenum…
.Molybdenum – Chinese Buying Spills into Ferro-Moly
• Strong Chinese buying is reportedly pushing the molybdic oxide price to firmly top US$10/lb so far this
week. Not only is China still buying molybdic oxide in great quantities, but it is also buying ferro-molybdenum
as oxide supply becomes scarce. “We’re seeing big enquiries from China, for a total of 800 tonnes of ferromoly,
and the number of oxide enquiries is ridiculous,” a trader told the Metal Bulletin
You know anything about respect Jake? If you did you would respect the picture of a great man and a great captain . There is consequences Jake ….consequences for this disrespective behavior…
Jake,
What do you feel is significance of the 14-34 week moving averages?
I’m familiar with the 10-15-20 an so on
I’ve also seen you use a 5 period RSI instead of the 14
Under what circumstances do you change the periods?
Thanks in advance.
Bruce — thanks, I’ve been doing the chart thing on stockcharts since they rolled out almost.
—-
RHill it makes me warm and fuzzy to know the Chinese are stocking up on moly. May the unscrupulous bastids try to corner the market like a Mandarin version of the Hunt brothers.
__________
Gotti — I have no control over the avatar choices, that’s Fly’s department. He lives near many of your relatives so maybe you can have a “heart to heart?”
__________
Mag — I am almost embarassed to say that I have been using the 13-34 week EMA’s on my weekly charts since I can remember. I think it was something I read in McGee, or Malone, or it could have been something I got from an older and wiser man than myself. Something about the equivalent trading days, IIRC. They’ve always worked rather well for me in any case.
As for the RSI, it should be set on 14, as I (usually) don’t mess with it, but it’s possible that I was toggling something one day and forgot to reset.
________
Chivas — that’s one persistant duck!
_____
Magpie:
Everyone has their own best indicators and their own best Time to evaluate. A 14 period RSI on a daily chart is 14 days. A 14 rsi on 5 minute chart is 14 by 5 minutes. Thus a 5 RSI daily is longer actual time than 25 rsi, on a 5minute.
Often analysts use 10 EMA as short time; 50, Intermediate term; and 200 day ema long term indicators. 13/34 is widely used as is 50/200 ma. A 2RSI is often used as a short time indicator.
Due to different Times viewed one could go: short 5min, long 60 min and short weekly charts. On this blog you find strongly defended differences of opinion on market direction. Currently Chivas,and Addict are calling a reversal while Fly has drunk the kool-aid and refuses to think this is a reversal (despite all the $NYMO,$nyad, $NABP charts pointing to the obvious tipping point.) Go short young man: long QID. It has already BTFO.
Heart to heart? your a funny guy. The Fly is a friend of ours . How would you like to swim in a vat of acid?
Mr. Gotti —
There’s an apostrophe in “you’re.”
Will this acid do anything for my freckles?
_______
Mr Gotti:
Do you have a long reach? If not, go sit on a hot Pepperoni.
Apparently, the reach is from the grave.
_________
I thought they found him in sing sing, bent over a chair in garter belt and tasteful 4 inch heels
Nah, dead for years. I think he was in Fed prison — out in Kansas or something.
____________