iBankCoin
Home / Gio (page 53)

Gio

Ekolu- Honestly

Well, its that time of the year again for me.  Tax season.  Yuck.  I hate it.  My mind and time are divided, hence I have now went to all cash this week.  This is going to be a very interesting tax season after what we went through in 2008.  I certainly am not looking forward to it.

Have a great weekend.  And remember…

… When a friend hurts you write it in sand.  When a friend saves you write it in stone.

Honestly,
-gio-

Comments »

Investors Hesitate To Bid Stocks Up as Traders Prepare for Lakers Versus Celtics Game

I’m applying for a job at Yahoo Finance, you know, the dude that writes the headlines on Yahoo Finance’s front page about the market throughout the day.  Yeah, I want that position so I can sit around all day and write dumb associations with the market.  So, until the market decides to go somewhere I will continue to hold off from making predictions on directions and instead practice writing headlines for the markets activity.  Seriously guys, the market has gone NO WHERE, and everytime I feel like we’re going to get a trend, we just chop right back.   It just amuses me how off Yahoo, CNBC, and other mainstream sites are about the tape.

Anyway, here’s a snapshot of Thursday’s tape.  No thunder there.  What we saw was an emotionally guided market in anticipation of Friday’s job #s.  Speaking of jobs, the market is still unemployed and will continue to collect unemployment checks from stubborn traders.

Today was a good day-trading day because a lot of the indicators were working properly… maybe it was due to the emotion in the market?  I mentioned the formula to spot a market reversal before, and we had it today…

  • Search for what’s dragging the market:  Banks. 
  • Which stock in that sector has influence:  BAC
  • Wait for reversal in VIX
  • Wait for BAC to bottom
  • Find the “relief point”, where the shorts will cover:  Can you find it?  I didn’t post the chart but you can use the SPX or DJI.  I’m sure the NDX has it, but I didn’t use it.

Now at least we know the Lakers are bullish.

Disclaimer:  I am short the Celtics.   And Golden State Warriors.

Comments »

Today was a “rare day trading day”

I gotta run right now, so I’ll explain later.  But if you can figure out why today was a “rare day trading day”, then at least I accomplished something. 

Here’s some hints:

1) VIX

2)  BAC

3)  FAS

4)  Relief point

… remember the checklist?

Comments »

Trade ideas for 2/5/09 Life Partners (LPHI), Edwards Sciences (EW), RTI

This is a stock pickers market.  I got three stocks worth trading tomorrow based on Wednesday’s tape.  They can either be day traded or swing traded:

1)  Life Partners (LPHI)

Chart for Life Partners Holdings Inc. (LPHI)

  • Rationale:  Wednesday, LPHI was the biggest loser on the IBD 100.  LPHI was a leading stock since late March before losing steam early November.  Late November the stock caught fire and rallied a little higher than its previous high.  That caught shorts off guard.  Wednesday stock was down 11% on higher volume.
  • Swing traders:  short this with a stop above 38 which was previous support.  Notice on the 5-day, LPHI rallied Tuesday, but that entire rally has wiped out.  If that gap is filled, then there is a swing trade opportunity on the long side.  However, I think reward is better on the short.
  • Day-Traders:  play the gap.  There may be a rally attempt back to 38, so I would enter daytrade shorts if LPHI struggles with 37.xx.

2) RTI Intl Metal

sChart for RTI International Metals Inc. (RTI)

  • Rationale:  Kind of similar to LPHI, except the long term chart for LPHI was nice, while RTI is ugly.  Look at the 5-day chart, you’ll see RTI was up about 10% yesterday for an earnings spike, but nearly all of that is gone + we are back below the roof of that channel.
  • Swing traders:  use the 1-month consolidation as your stop point.  I like this as a longer term short.
  • Day traders:  play this either way.  You have 13.90 as a selloff point, and 14.20 as a breakout point.

3)  Edwards Lifesciences (EW)

Chart for Edwards Lifesciences Corp. (EW)

  • Rationale:  EW had a runaway rally after reporting good results and outlook on Wednesday.  Stocks high is 66.
  • Swing traders:  look for a slight reversal under 60 before getting long.  Buy 1/2 now and 1/2 just below the 52-high.  Set stop for initial position to 58.
  • Day traders:  use the flag at the close.  Buy above 60.20 for continued move.  Probably doesn’t move much though.

Other notes:  NYSE notched another distrbution day yesterday.  That makes it 2 distribution days since IBD issued a follow-through day.  Tomorrow will be filled with earnings, so I’m going into tomorrow expecting choppy waters.

Today I jacked a BAC chart from DistressedVolatility .  He uses options activity and volatility indicators for direction on individual stocks.  I’m a fan of the put/call ratio so I think its a good way to track a highly volatile stock… like BAC.

http://2.bp.blogspot.com/_xlGBqqM0muE/SYqZzzP6y7I/AAAAAAAABAg/5N4lAox5YAc/s1600-h/bac3.PNG

Comments »

FAZ-notastic day trading

Hey guys, just as promised here’s a post of some ugly trading I did in FAZ today.  Once again, if there is no volatility in the VIX I’m like a one-legged Spartan with no sword.

3 bad entries:

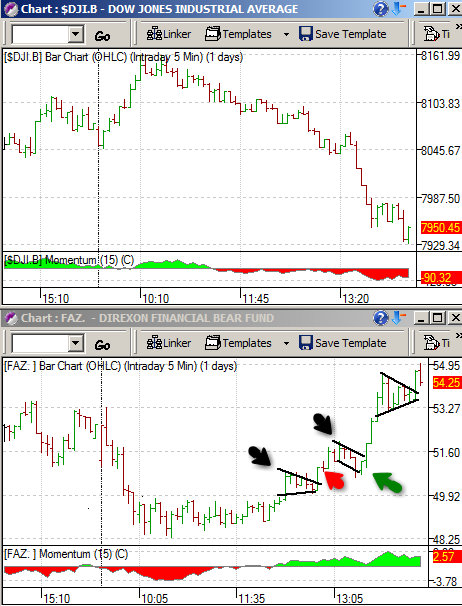
Black arrows–  those are my bad entries for longs.  They were false breakouts that led to a flag.  Did it to me twice!

Red arrow–  bad entry to short FAZ.  Wow, that was lame because it made me go from short FAZ to long FAZ at the wrong time!  Two steps back kind of thing.

Looking back, I should have just held FAZ the entire day.  However, there wasn’t enough volume in the tape for me to pick a side.  Notice the momentum on FAZ… that was tricky because it was deep red early in the day, and as it melted up there was very little momentum- that’s what gave me a false signal to short FAZ.

Finally, seeing how out of sync I was, I went constanza on myself (lol) and bought the first failed test of FAZ at 51.60 (since normally you would short FAZ there. Ha!).  And, true to the anti-tape FAZ took off.  What a lame stock. Anyway, I wouldn’t suggest trading that way, nor would I suggest trading this tape.  I think I was fortunate for buying FAZ at the failure of 51.60 but rarely does that ever happen… so yeah, I made stupid money there.

Looking back one more time, I should have simply played the flag breakouts on FAZ (which is equal to the flag breakdowns on the DOW). But whatever, tomorrow we fight, and this time I’m bringing a sword.

Oh, one more thing.  Someone asked me about what the “imbalance” in the tape is that me and UpsideTrader keep mentioning on StockTwits… well, I’m not sure what Upsider’s view is but it’s probably close to mine…  for me, it’s a momentum term that is influenced by day-trading capital and swing traders who are on the side-line.   That capital has to go either on the long or the short, while those aready in the market have the choice to sell or add.  So, think of the tape as a see-saw on a pivot.  When momentum shifts to one side then all that capital piles up and causes momentum to build more until we get “imbalance”.  You want to be on the imbalance side (heavy side) until it gets “too high.” What happens when it gets too high?  People start jumping off and the see-saw shifts right back.  Many times day-traders will play this imbalance one of two ways:

1)  ride the See-Saw down (the heavy side), which is like going with the momentum in the direction of the tape.

2)  or riding the See-Saw up (counter-trend) as stock moves back to equilibrium.  This one requires you to be real patient to enter, and real quick to exit.

This happens quite a lot intraday and its more conspicuous if you use 1-hour charts.

Comments »

Pre-market notes for 2/4/09

Leaders are leading!

–  Take your meds… MYGN at an 8-year high after beating the street.  Tides rise:  AFAM catches a bounce.  ISRG spikes above 110. One med stock I don’t like is PRGO … its generic anyway.

–  Cup of coffee?  GMCR set a buy trigger.  Heading to new highs.  SBUX still is SBUX minus the ‘B’

–  Still too early to attack the school stocks.  Each company that reported has so far blown past expectations.  COCO, CECO, APOL, ESI

Scratching my head:

–  Keeping an eye on those divergences in the inverse ETFs… how is it possible that the Dow goes +120, and FAZ stays +4%.  Nonsense.  Stay away from them.

VIX is stupid.  Continue to use technical and momentum indicators.

Continue to use Monday’s bear-tail (bullish sign), and today’s wedge pattern for technical indicators.

2/3

2/2- proved helpful on Tuesday’s tape…

… notice Tuesday’s tape, how the market really reacted to that 7940 point I alluded to.  Provided excellent support…

… bounced at 7943, and finally, notice the breakout above 2/2’s tail.  Classic.

See, I don’t only use the VIX. Lol.  So bears, I’m bearish long term, but I’m not seeing good setups here to stay short.  Probably the most convincing tell for me is that leaders moved Tuesday’s funky tape.  If you’re into shorting, you want to short rallies where laggards are leading, like what happened in early January (with the VIX under 40 = superior entry for shorts).  But yeah, I play the tape how I see it, so I’m using Monday’s and Tuesday’s story on the tape to guide my bullish plays.

And my jacked chart of the day goes to…  Jeffrey Lin from the FinViz posse, for his magnifying glass analysis of a dried up SKF.  Not bad bro, $20 move since.

picture_32

Laterz!

-gio-

Comments »