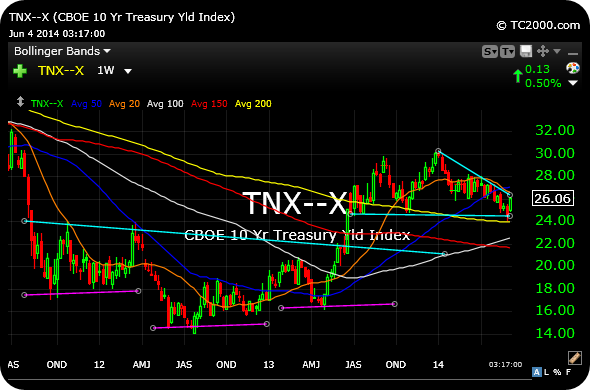
The weekly chart for the 10-year yield (inverse to bond prices) shows that yields have reached the nadir of a descending triangle throughout 2014 (light blue lines).
Yields are still well above the 2012 lows, with the inverse head and shoulders multi-year bottom confirmed despite the rally of bond prices in 2014.
The ECB announcement later this week is likely to cause some short-term volatility in bonds.
But if bond bears are going to make another push higher in yields to follow-up the spike we saw last summer, the time is now from a technical perspective.
_____________________________________________________