iBankCoin
Full-time stock trader. Follow me here and on 12631
Joined Apr 1, 2010
8,861 Blog Posts

Sniper Time

https://www.youtube.com/watch?v=7KBw1Fto0pM

I am back to being short bonds [via long TBT], for the first time in several months.

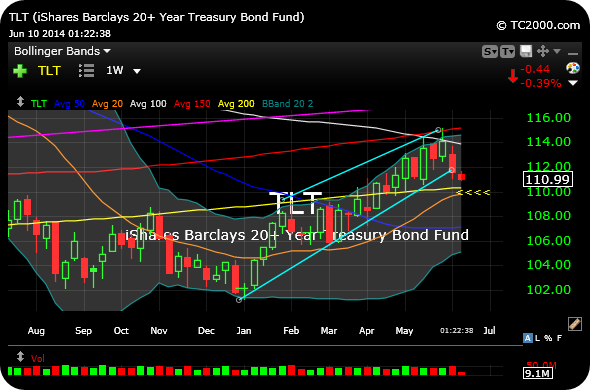
The straight-up ETF for bond prices, below, shows the 2014 rally is in danger of cracking after the crack of the rising channel (light blue lines).

An initial target is the middle weekly Bollinger Band, which is the orange line (20-period weekly moving average).

If TLT closes back over $113 the thesis becomes essentially void.

_______________________________________________

TLT

Comments »

Five Stocks Fighting the Good Fight Today

BZCpDQr

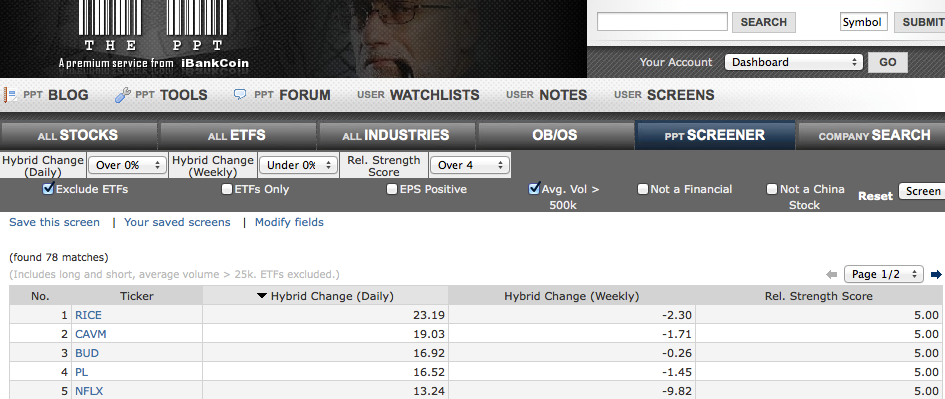
Courtesy of The PPT algorithm, here are the most current top five readings from my “12631 RELATIVE STRENGTH” custom-made screen, identifying which stocks are exuding some of the best performances to the market at-large at any given moment.

I look for stocks whose Daily PPT Hybrid Score surges, while the Weekly Hybrid has been negative over the past week. This can often yield stocks which are emerging from consolidations.

Members can click here to view and save the screen.

Sorted for at least 500,000 shares of daily average volume to ensure liquidity.

Please click on image to enlarge.

________________________________________________________

2014-06-10_1206

Comments »

Social Butterflies in Swing

swingers

The social stocks, namely FB LNKD TWTR, are all quite strong this morning.

Facebook is breaking out from a well-defined sideways channel, seen not he first chart below. Holding $64.30 is now key on a closing basis.

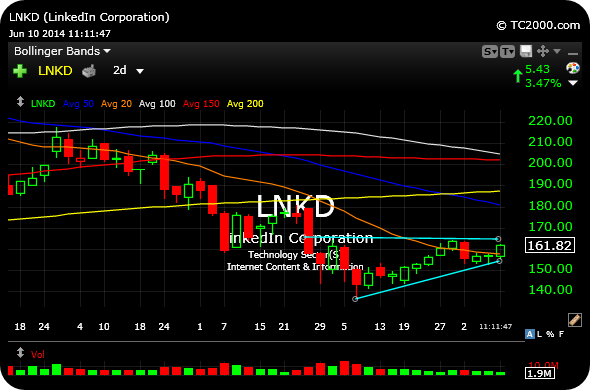
LinkedIn is still damaged good, but has room for a sharp bounce up to its 50-day moving average.

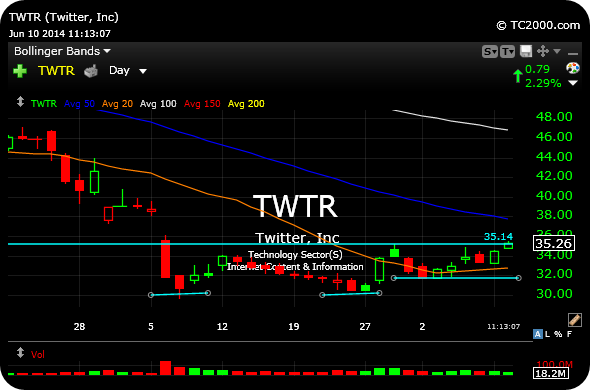
And Twitter needs a close over $35.14 to confirm the daily chart, inverse head and shoulders bottom, third below.

_______________________________________________________

FB

_______________________________________________________

LNKD

_______________________________________________________

TWTR

Comments »

Try to Learn from This Loss

I ended up taking a loss on UGAZ, erroneously allowing it to quickly morph from a winning into a losing position.

Here was my note to 12631 members just now:

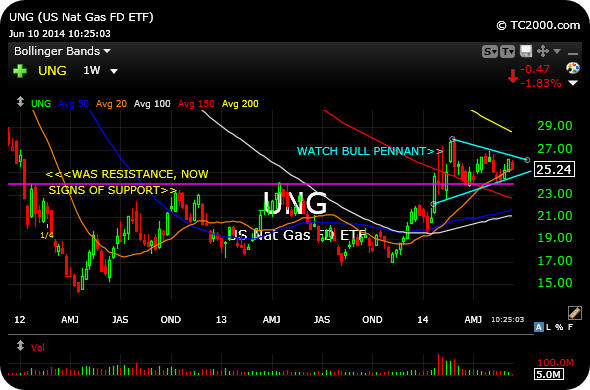
Sold $UGAZ starter long @ $25.10 from $26.01 entry for a loss. Poor trade letting the winner turn into a loser quickly. Overall natural gas weekly chart bullish setup still intact but should have traded the volatility better.

And here is the updated UNG weekly chart, still intact for a bullish coil.

However, I should have sold at least some into strength last Friday and sought a reentry this week.

__________________________________________________________

UNG

Comments »

Early Morning Shopping Spree

203

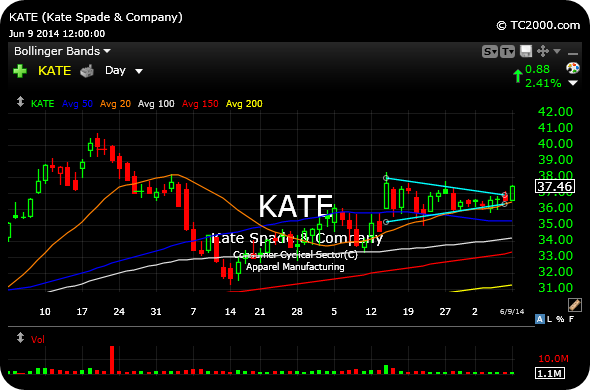
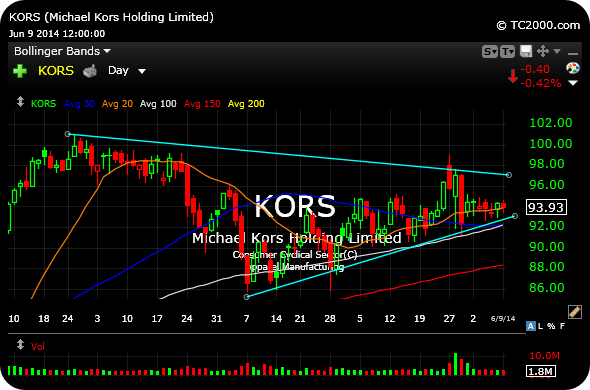
KATE KORS are two of the better technical retail setups out there right now, both basing tightly sideways and ripe for further strength.

What are you checking out this morning?

________________________________________________________

KATE

________________________________________________________

KORS

Comments »

Short the Hot Vegas Summer

The following is just a small excerpt from my latest Weekly Strategy Session (please click on that hyperlink for details about trying it out). which I published for members and 12631 subscribers this past Sunday. 

 The best short ideas I see are still in the major casinos. You will note how badly they have lagged the snapback rallies in the leaders and strength in the Dow and S&P of late. If we do get that market weakness especially this week, I would be looking at CZR LVS MGM MPEL WYNN as short ideas.

Also note the potential for major topping out patterns in play.

Please click here to continue reading

Comments »