iBankCoin
Full-time stock trader. Follow me here and on 12631
Joined Apr 1, 2010
8,861 Blog Posts

Sold Some Crude Into the War Games

5C5HUj6

Updating my earlier discussion about crude oil, the USO ETF is still holding the gap higher this week.

However, into the weekend I am inclined to lock in some of the gains, with headline risk in play.

Here was my note to 12631 members just now, using the UCO Leveed ET

Sold 1/4 of 3/4 position long $UCO @ $39.33 from $37.59 core entry and $39.02 add to lock in partial gains. 1/2 position now.

Comments »

Other Bottles from the Cellar

4bjXFOb

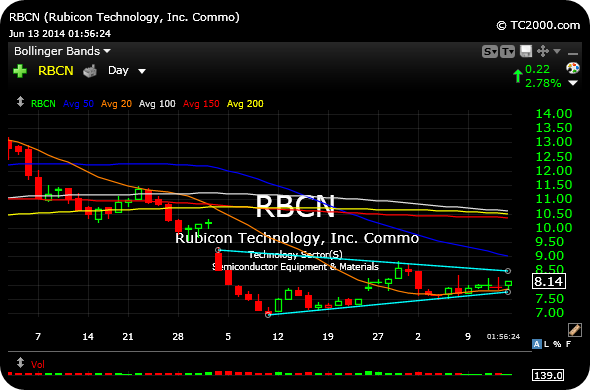
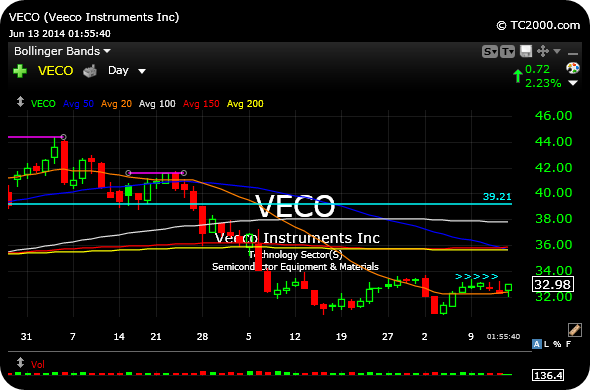
In addition to CREE as a snapback rally, beaten-down long idea, RBCN VECO are similar companies with similar charts to consider into next week.

I suggest keeping stop-losses tight, below today’s lows, for example, to avoid a downdraft if these damaged charts are unable to muster even a reversion rally to their declining 50-day moving averages.

________________________________________________________

RBCN

________________________________________________________

VECO

Comments »

You Better Lawyer Up, Facebook Buyers

660851_1299911746618_full

A big test into next week is whether Facebook, leading the social stocks this week, can hold $64.30 on this check-back to it today.

You can see the daily chart, below, illustrate why that level is so important, posing as the breakout point for the sideways consolidation spanning several weeks. A sharp move below it would force us to consider whether we get a fast move lower from the failed move over $64.30.

For now, though, the jury is out and this is a good test for the leading issues to see if Facebook can find support at prior resistance and turn back up.

_________________________________________________

FB

Comments »

Still Conducting Special Ops

HB2JZB1

I am still playing beaten-down longs, a rarity and even a special situation for me as I typically favor technically “healthy” charts for longs.

However, in this market I have found the damaged tech/growth names to have been fairly fruitful for quick snapback bounces in recent weeks.

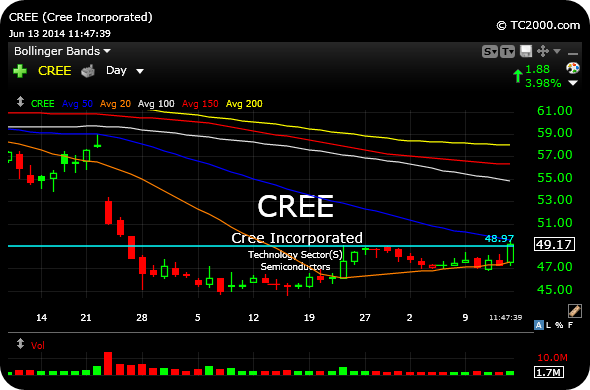
I am long Cree here, seen below on the daily chart looking an awful lot like FEYE and other assorted beaten-down names.

I am playing for the stock to make an attempt at a run into the mid-$50’s, with a stop-loss below $47.

These are still higher risk plays, so I have one eye on the exit the whole time.

_______________________________________________________________

CREE


Comments »

Gap and Black Gold

blackgold-topgraphic

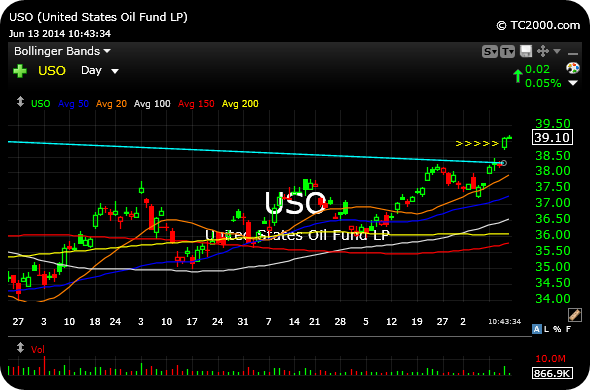
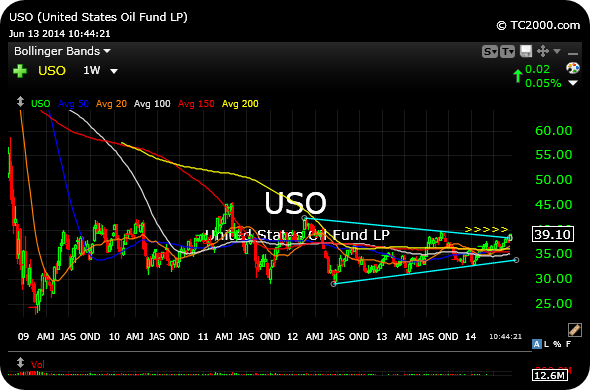
The longer this week’s gap higher in crude oil, portrayed by the USO ETF on the daily and weekly timeframes, respectively below, does not get filled the more likely I am inclined to view it as a bullish breakaway gaol which will not get filled going forward.

The daily chart shows the gap higher this week. And, keep in mind, another reason which has me continuing to lean bullish crude is that we have seen so many false breakouts over the past few years that it is easy to believe we will see a fade once the Iraq panic is lifted.

However, it is worth noting that crude was already set-up technically before the news hit, with the weekly symmetrical triangle I outlined on the second chart.

That said, I will likely trade around my UCO long position so as to take advantage of the surges and natural volatility. Still, I am looking for a reason to keep a core position, and an unfilled gap is more than sufficient.

_______________________________________________________________

USO

_______________________________________________________________

USOW

Comments »

“‘There She Blows!- There She Blows! A Hump Like a Snow-Hill! It Is Moby-Dick!'”

The following is just a small excerpt from my latest Weekly Strategy Session (please click on that hyperlink for details about trying it out). which I published for members and 12631 subscribers this past Sunday. 

 After not having experienced a correction in a way the Russell 2000 or even Nasdaq Composite Index did earlier this spring, the S&P 500 Index is now flashing signs of “blowing off” to the upside.

The daily chart illustrates, with the yellow line, the steep rising angle in recent weeks, while the light blue line now denotes the sheer extension of price away from that elusive 200-day moving average. Both of these circumstances, combined with the multi-year uncorrected bull run, add credence to the notion of a parabolic, exhaustion move in progress. In essence, you might argue this figures to be the cherry on top for bulls, with stubborn shorts being literally run over.

Timing the end of such blow-off moves is notoriously difficult, though, given that an exuberant grand finale of a bull run is far less predictable than than the end of a bear market (in which we see fear and panic followed by apathy). The duration of these moves can often defy the bounds of reality for even the most bullish of bulls. 

With this in mind, I am going to focus on being prepared for several different scenarios this weekend, given that I view the randomness of the current market to be as high as any in recent memory.

a)  A Better VIX “Tell” 

First and foremost, to update the VIX thesis from two weekends ago, volatility is sinking even lower and the thesis to buy weakness in the seemingly broken the volatility ETF’s – TVIX UVXY VXX –  has been rendered incorrect so far.

The VIX is usually known to measure the amount of “fear” in the options market, with a low VIX typically meaning a lack of fear and a high VIX, above 20, indicating an uptick in fear. 

Looking at the multi-year chart of the actual VIX, it appears that a move down below 9 would be the higher probability place to now wait to initiate a long volatility trade. In previous bull markets, a move down into the single digits for the VIX typically marked a good, multi-quarter low for volatility. 

b) Be on Close Watch for the Key Reversal Day

Operating under the assumption of the S&P experiencing a blow-off move in progress, we should be on close watch for a potential gap higher early this week and subsequent reversal lower by the closing bell to market a key reversal day. 

At this stage in the bull market, we have seen so many false reversals and “bear traps,” with a great many apparent topping candlesticks or bearish patterns amounting to nothing, it is likely that a reversal this week would not be met with overly bearish sentiment and thus add credence to it before we even see if confirmation materializes immediately after.

c) The Small Caps Still Diverging 

While the Dow and S&P make new all-time highs, the small cap, high beta growth stocks housed in the leading Russell 2000 Index remain under their March highs.

We have been staying away from the short side in these beaten-down growth leaders largely since late-April/mid-May, largely due to the fact that they became so quickly oversold that a sharp relief rally endangered shorts to a high degree.

However, the larger picture of the Russell still points to not only the diverging price action versus the S&P and Dow, but also a major topping pattern still in play. I present the same weekly chart for the Russell twice to illustrate two points.

First, the Russell is still operating below a steep trend (light blue lines) dating back to 2012, despite last week’s bounce-back.

Next, the Russell is still working through what can be deemed a major head and shoulders topping pattern. I am keying off 1,180 to the upside to see if the recent bounce falls flat there. In order to confirm the major topping pattern lower, a close below 1,082 is necessary.

Please click here to continue reading

Comments »