
Ultramarines Space Marine Chapter preparing for the First Battle of Armageddon
—
This article will attempt to explain what I look for, the best setups to short, how to short using MAs and other technical basics dealing with short selling. Short selling is for intermediate and expert traders and I do not encourage beginners to jump into shorting stocks, especially if you are the type that likes to hold onto losing positions. Treat this only as an educational article since I am not providing any legal or financial advice.
There are numerous patterns that one can search, however, I focus on 7 primary setups for shorts (If you read my article on long patterns, there were also 7 patterns). The patterns are as follows:
—Patterns—
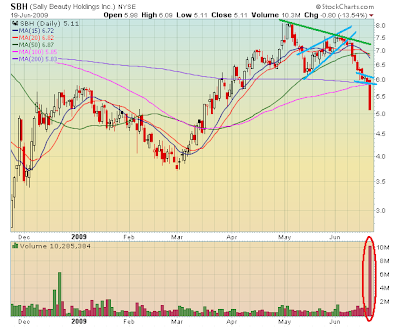
1) Double Top:

The double top formation takes several weeks or months to develop. It’s a reversal pattern that stops an extended uptrend. The 2nd top is unable to make a new high and threatens to breakdown from the neckline, which is the nearest support for both peaks. The idea short entry is either early on the breakdown or on the flag (if develops at the neckline). There are several secondary entry points in case you miss the first.
2) Descending Triangle:

The descending triangle is an easy pattern to find. This triangle holds horizontal support, but continues to make lower highs, creating a downtrend. The ideal entry is to enter before the triangle breaks since the breakdown is usually a gap down or a powerful intraday breakdown. I always take the risk to short as the triangle develops.
3) Initial Breakdown + Flag Combo:

The initial breakdown + flag combination is 2-part. Part I consists of a major breakdown (usually the largest red candle present in the entire uptrend) on massive above average volume (typically the largest volume present on the chart). Part II consists of a flag that indicates that the stock is in a reactionary rally and the volume must be low. The ideal time to short is not on the initial breakdown, but on the flag.
4) Head and Shoulders:

The H&S is a popular pattern. The most important part of the pattern is the right shoulder since a lower high is necessary to confirm that the uptrend is ending. Like the double top, you have the option to short on the breakdown or on any flag that develops on or near the neckline. Typically, there are several short entry points following the initial move lower.
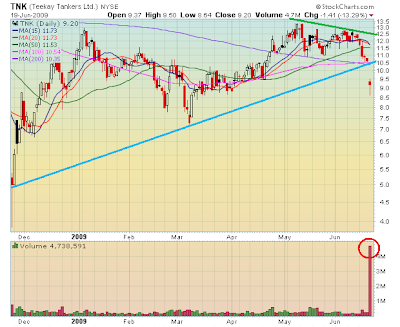
5) Rising Wedges:

Rising wedges would be difficult patterns to determine if it weren’t for volume. The wedge is a uptrending trading range that will become more and more narrow as it reaches the apex. Volume must get lighter and lighter as the pattern progresses. You may enter the wedge before a breakdown, but I like to short in the breakdown (which should be accompanied by volume expansion) for confirmation.
6) Parabolic Moves Up:

These are stocks that jump 100%, 200% or more in a span of several days. The top of the pattern is marked by buying exhaustion and the best way to determine the exact top is to look out for the following candlestick patterns: doji, gravestone doji, long-legged doji, shooting stars, dark could covers, and bearish engulfings. All patterns are typically accompanied by the highest volume bar on the entire chart. Entering on the topping day may provide more profit, but it is riskier. The next day is considered the confirmation day in which the stock breaks down. The 2nd option for entry (less risk) is to enter at the very beginning of the breakdown.
7) Bear Flags/Pennants:

Bear flags/pennants are the most common short patterns. They mark continuations in a downtrend and are highly reliable (similar to bull flags). The idea time is to obviously get in before the breakdown, and you may only have 1-2 days to do so. The volume must be light on the flag, and the volume should increase singificantly on the breakdown. Think of this pattern as an inverted flagpole /w flag.
—Moving Averages—
In addition to the patterns themselves, moving averages play an important role. I use the 20-, 50-, 100-, and 200-day MA’s for long and short setups, but I also incorporate the 10- and 15-day MAs because a stock declines much faster, thus you will need a much shorter-term MA. Find the right MA that guides the stock because not all stocks follow the same MA.

I categorize moving averages in two ways: MA’s acting as resistance and MA’s for churning. Moving averages act as magnets and they are just as reliable as the setups they guide. When we went long, we used the various MA’s as support which acted as springboards to propel the stock higher. Think opposite of that now. MA’s for churning simple means that a stock flags either immediately above, on, or under a stock. Usually, the stock cannot make a higher higher and/or a 2nd MA is looking to catch up to the stock.
—Books—
Recommended books on short-selling:
1) How to Make Money Selling Stocks Short by William O’Neil (Wiley, 2005) – [Technical, Swing & Position Trading]
2) Sell & Sell Short by Dr. Alexander Elder (Wiley, 2008) – [Technical, Day Trading]
3) The Art of Short Selling by Kathryn Staley (Wiley, 1997) – [Fundamental]
4) Sold Short by Manuel Asensio (Wiley, 2001) – [Fundamental]
5) Sell Short: A Simpler, Safer Way to Profit When Stocks Go Down by Michael Shulman (Wiley 2009) – [Macro]
—
The best way to become an effective short seller is by making it a habit of studying hundreds and even thousands of charts every week. Train your eye to see the setups, the accompanying volume, how the MA’s line up, etc. The only way to do this is with practice. Short-selling can become very profitable due to the simple fact that stocks drop faster than they rise (in most cases) and for me, it typically only takes about 1-3 days to make a decent profit of 10% or more.
Trade only the best setups to increase your odds. I do recommend the use of stop losses above key resistance areas due to the fact that losing short positions can cause serious damage if left unattended.
—Short Setups—
Here are some POTENTIAL short setup that I found over the weekend:


Comments »


