Happy Holidays! I don’t mean to be a bummer but I see a potential Grinch around the corner that may steal the rest of the Santa rally and in fact could be a very dangerous set up. I see several things pointing to the fact that we are close to the top of this brief rally from Monday’s low. We have been in a downtrend since the November 3rd top with deep Fibonacci re-tracements that are tradable but the over all trend has been down as we have made a series of lower highs. The most important factor for my warning is that the cyclical structure of this market since the December 2nd trading cycle top looks very similar to the July-August cyclical structure. In July we came out of the trading cycle low on the 7th of July and peaked 9 trading days later on July 20th. That top was a trading cycle top that was very left translated. The average trading cycle runs 40 trading days from low to low so if you top in under 20 trading days it is left translated. Since that one peaked in just 9 days it was extremely left translated. Left translated tops are bearish because the market has more time to go much lower in price before the bottom. In a bull market trading cycles are right translated meaning the top occurs more than 20 days from the previous low so it has less time to go lower in price so the low is higher than the previous trading cycle low which creates the higher highs and higher lows of your typical bull market structure. In simplistic terms right translation means BTFD and left translation means STFR.
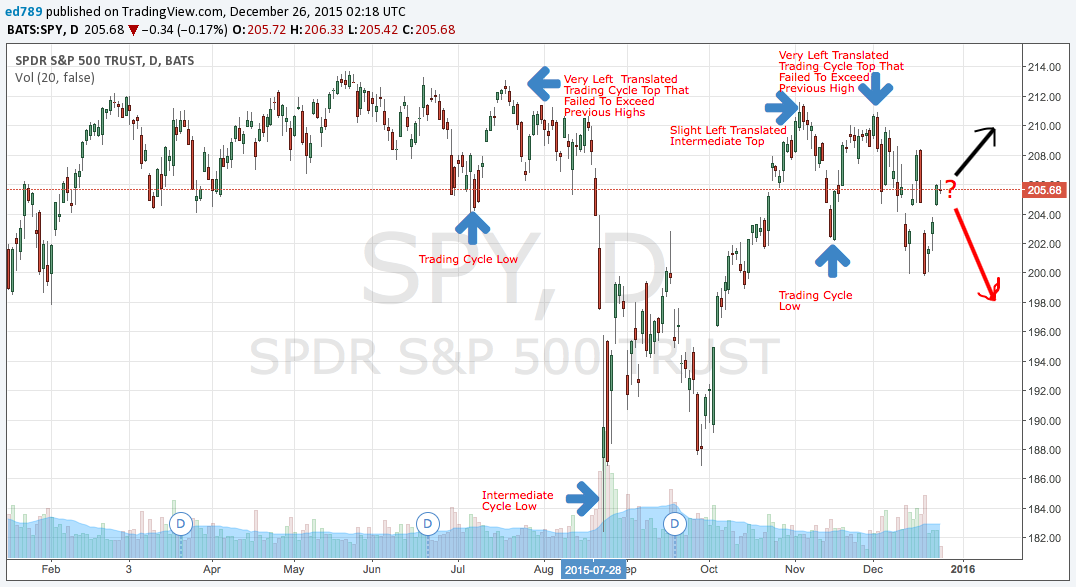
The December 2nd trading cycle top, like the July top, peaked in 12 trading days from its November 16th trading cycle low which was also very left translated. In addition, it has made lower lows since the November 16th low which is also a sign that the December 2nd high was the trading cycle top. From a time perspective the July-August structure is very similar to now. The trading cycle low on July 7th to August 18th (before crash launch) was 30 trading days while this similar November-December cyclical structure is at day 28 as of December 24th. Some might argue that last Friday was the trading cycle low which could be the case and we could see a rally thats goes above the December 2nd high. However, that would be unlikely because it would mean that the trading cycle bottomed in 23 days which is not within the timing band of the trading cycle low and would be a week too early. The average trading cycle runs 29-43 days from low to low so the odds are the current cycle low lies ahead of us. If this count is right could it be a crash like August? No idea but if we take out last Friday’s low I don’t think its going to be pretty as everyone is looking up for the Santa rally and seems to think the worst is behind us.
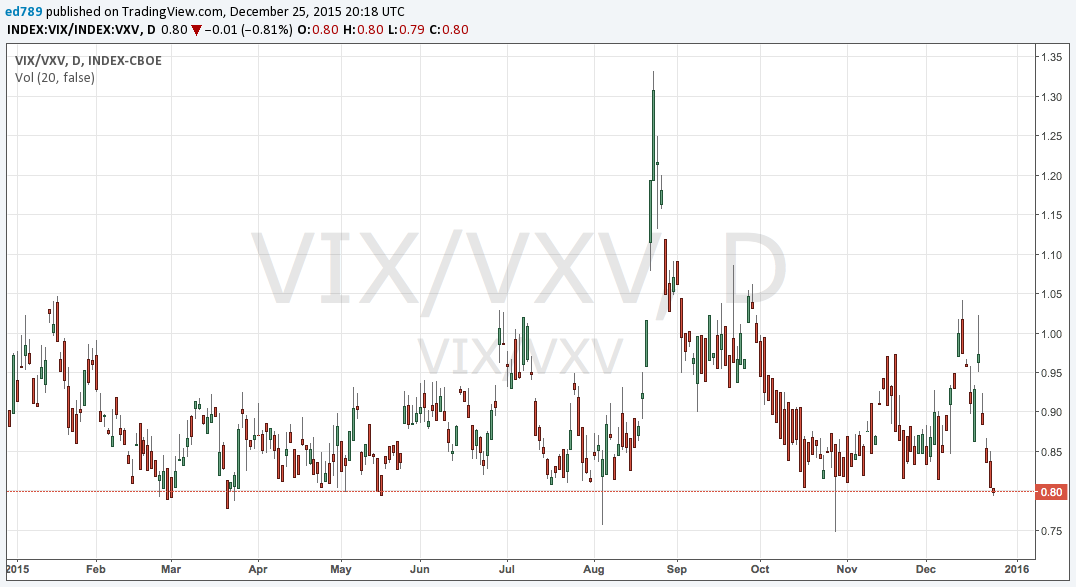
In addition to the structural set up described above we are extremely stretched on my VIX indicators. The vix indicators I use are not 100% accurate but they do show how stretched the current price action is due to temporary volatility suppression. As a general rule over the last year when these indicators get this stretched the market loses price momentum and rolls soon thereafter. The VVIX/VIX ratio (Chart 1 below) is at an extreme as well as the VIX/VXV ratio (Chart 2 below). Christmas Eve Price action blew these indictors out.
Chart 1
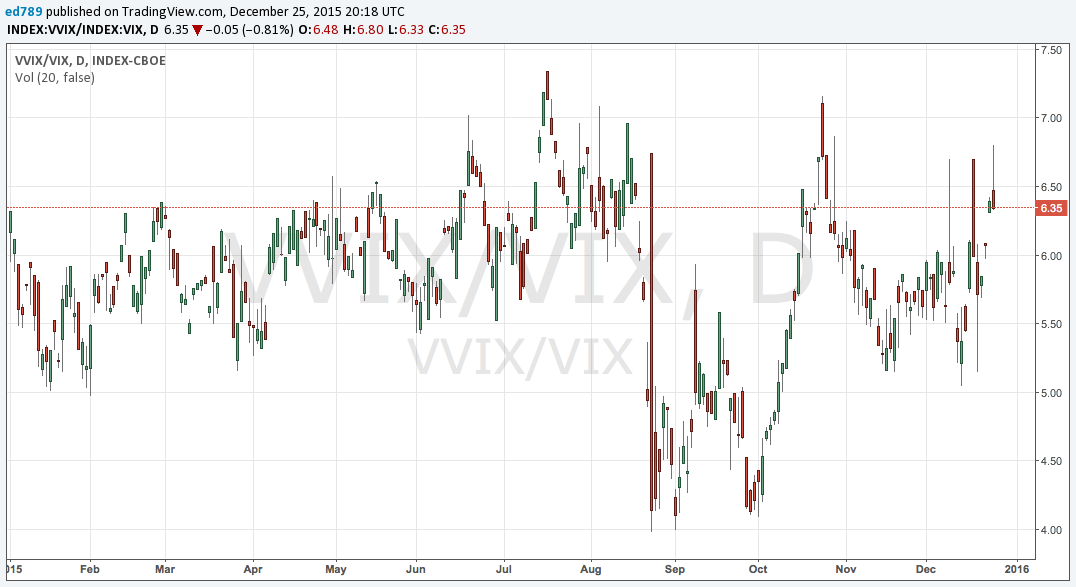
Chart 2
The bearish fundamental case has been around for awhile and is fairly straight forward:
1) The Fed is tightening and liquidity is leaving the system.
2) Credit Spreads are blowing out and are much wider now than they were at the August equity crash lows. The credit cycle has peaked and equities will soon follow. Liquidity in Junk Bonds is non-exitstent.
3) The strong dollar is causing deflationary pressures around the globe which have collapsed commodity prices which in turn is putting pressure on Corporate profits and cash flows which has also led to the credit cycle peak.
4) S&P profits and revenues are rolling over and on a trailing twelve month basis profits have dropped to mid 2013 levels when the S&P was at 1660 making the trailing 12 month PE 21 versus the then 17 PE. Not very compelling in my humble opinion.
5) A literal plethora of geopolitical nonsense that could lead us into WWIII.
Basically if you are bullish your implicit bet is that we get multiple expansion on decreasing revenue and earnings at the beginning of the first Fed tightening cycle in over 10 years with rumors of wars everywhere. Sounds like a reasonable bet if you are certifiably insane and/or a Millennial.
The internal indicators of the market are improving a little bit but they were also doing the same thing in August before the crash. If the above cyclical structure is correct it will trump the internals and we should roll soon and hard. Structure trumps everything in the end.
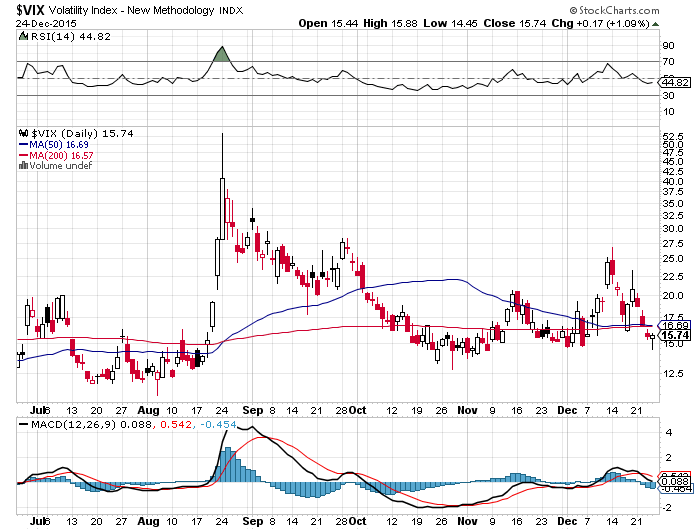
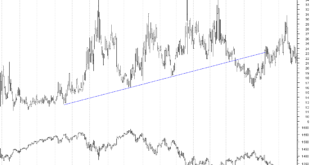
Bottom line: I believe that we have seen the Santa top on either Thursday the 24th or we will in the next day or two with a slightly higher high than the close on Thursday. I also think if I am right we will see volatility explode into the new year. The structure of the VIX and the VVIX have been altered since the August crash with rising trend lines of higher lows. The VIX low made on Thursday had a nice hammer reversal candle (Chart below). I loaded up on Volatility about an hour before the close. From where I sit the stars are lining up to take this market down.
As an aside the rally out of the August low to the November 3rd high was a higher degree rally. I was not expecting that in October. I was wrong. Cycle work is an art not a science. The November 3rd top was likely an intermediate top and potentially a seasonal cycle top. If it was the latter as well…then look out below. The last seasonal cycle low was August 24th so a seasonal cycle top in 2 months is so left translated it is beyond bearish. If we go to new ATH’s then all of my above analysis is just wrong and we get Unicorns and Rainbows. I get my cycles work from Tim Wood at Cyclesman.com but I augment it with my own fundamental and technical indicators which don’t always line up with Tim. They are lining up now. I like cycles because that is my religion and belief system. As above so below! Everything is cyclical IMHO. Part of me hopes that I am wrong because if I am not then the next 12 months will be horrific and the structure before us today will lead to fantastical future headlines of doom and gloom. However, note that I will be turning bullish into those horrendous headlines if the right cyclical bottoming structure appears. Markets never bottom on good news.
If you enjoy the content at iBankCoin, please follow us on Twitter


as to your point on the vix all the main indices except the NAZ have doji’s at the Thursday’s top sitting just under the 50 DMA. Looks like a reversal to me!
Great research.
Good stuff Blue. Great to have you on deck letting us know when you smell ice.
Happy holidays to you!
@BLUESTAR –
This is an excellent post. Thanks for the honest due diligence. May the force be with you.
Grinch indeed. I think NQ futures start selling off more on Monday. Have to see. I plan to get short Sunday night…if the price is right.
Bring it, thanks Bluestar
good interview
Grant Williams 1hr https://www.youtube.com/watch?v=swP4TFjBpfM
Hi Bluestar, could you explain how the strong dollar is causing deflationary pressure around the globe? As a follow up, what is the relationship (if any at all) between the strength of the dollar and inflation, i.e., does one cause the other?
Party like it’s 1929
https://www.sovereignman.com/trends/what-silicon-valleys-orgy-of-christmas-party-excess-says-about-america-18410/
History of oil industry (Corbett) 1.2hrs
https://www.youtube.com/watch?v=ySnk-f2ThpE
Ok, who “shot the market in the back” yesterday?
Hey Everybody,
Its ok now Freebie is here!. He is magical. You can short with abandon.
boyaj,
There is $9 Trillion in emerging market debt. As the dollar goes up that debt becomes more expensive to service. Also we are the reserve currency of the world which means commodities are priced in Dollars which means as it rises commodities go lower hurting the revenue streams of commodity producing nations,.
Thanks Blue, the idea behind dollar gains making emerging market debt more expensive to service makes sense, especially in the those countries that issue so much sovereign debt.
However, I should have been more clear about my question regarding the relationship between strength of the dollar and inflation. From a domestic perspective, does one cause the other at home, or are they totally separate from each other? I’ve heard the economic argument go a bunch of different ways, but I’d love to hear your input on this. Thanks again.
Sentiment Trader reading bad joojoo short term.
boyaj,
Its not always correlated but generally speaking we have more inflation when the dollar weakens. But its not perfect.
Can we bump this to the top?