For those unfamiliar with Point and Figure Charting, you can read up on the basics from some of my previous posts, Intro, Part I, Part II.
Wierdo Jay has asked if I would go over how price targets are determined.
When using PnF charts, you determine price targets (or objectives) using two methods called the “vertical count” and the “horizontal count”.
A little more background on the “counts” and the theory behind them:
The methods come from analogies drawn from the science of ballistics (if you’re an anti-gun lobbyist, you might want to skip this section).
The distance a bullet travels when shot from a gun is dependent on five factors:
1. The amount of pressure generated by the powder or gas in the gun chamber
2. The length of the gun barrel
3. The amount of resistance the bullet encounters through the bore before it leaves the barrel
4. The air temperature and resistance
5. The angle of the barrel relative to a horizontal plane, i.e. the influence of gravity
It is these same principles that Point and Figure applies to stock and commodity trading to arrive at a rough estimate of a price objective following a breakout from a consolidation area.
The vertical count is the most reliable and is what I use primarily.
Before I get into that subject, let me state that in addition to the count, one should also rely on other forms of technical analysis and use them in conjuction with Point and Figure. Also, just because a stock hits a bullish price target, doesn’t mean you automatically sell it. You have to look at things like relative strength and the trend as well in your decision whether or not to sell (or even add to the position).
The Vertical Count
Even though PnF charts produced on sources like www.stockcharts.com already have the price objectives shown, it is still helpful to understand the theory behind how those price objectives are arrived at.
When a stock bottoms out and starts to move up, it will give a simple buy signal at some point. The buy signal is when the column of X’s is higher than the previous column of X’s.
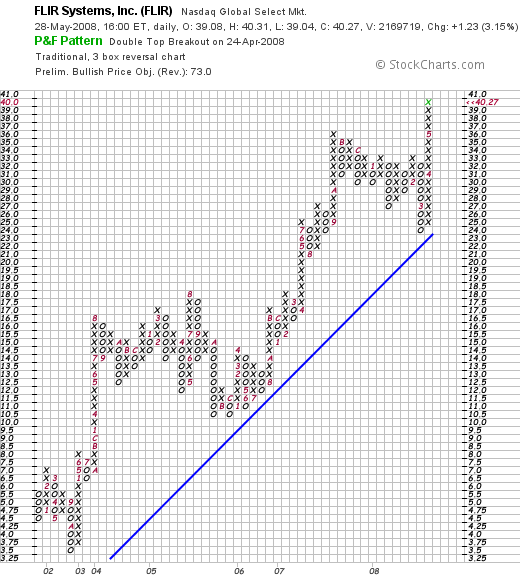

FLIR, currently trading around $40, broke a double top when it moved up to $34 in April. At that point, the bullish price objective was $55.
The bullish price objective is now $73 with the stock trading at $40.
How were those numbers that arrived at?
Look at the column of X’s that preceded the last column of X’s furthest to the right. FLIR got to $33 before reversing into a column of O’s (suppy came back in). Then it went all the way down to $24 before reversing up again. This reversal set up the buy signal when the stock broke $33 (the double top).
The price objective is determined by counting the number of boxes in the last column of X’s and multiplying that number by three (because I’m using the three box reversal system). Then multiply that figure by the value per box. Add that result to the bottom of the line of X’s (where the column began) and you arrive at a price objective.
So, when FLIR moved to $34, it gave a buy signal, initiating the breakout from the double top. Once it hit $34, the price objective was calculated as follows:
Number of X’s in last column: 10
Price objective = (10 x 3 x $1/box) + $25 = $55
At that point, would I take the trade?
Having an idea of a potential price objective is essential in determining whether to act on a buy signal or not. I typically want to have at least a 2:1 ratio of reward to risk. That is, for every dollar of risk I take on, I want the potential to make at least two dollars of profit, or the trade is not worth it, in my mind.
So, depending on where I set my stop loss point, I can get an idea of the downside. Using the PnF “count” helps me determine the upside potential. Now I have an idea of the reward to risk ratio.
Judging from the chart, if I had looked at this trade, I would probably have set my stop at $28. So downside is $6. Upside from $34 is 21 points. That’s at 3.5 : 1 ratio, so I would have taken the trade.
(Note: there is no overhead resistance that has been established on FLIR. It is in new uncharted territory.)
If I had set my stop at $22, just below support, which is $23, now my ratio is $21 : $12 = 1.75: 1. It’s close, but I would wait for a pullback to $31 before buying. If that was the case, I would have missed the trade because it only pulled back to $32.50 before breaking out above $34 again.
Today, the stock is trading around $40. The price objective is $73:
Number of boxes in last column: 16
Price objective = [16 x 3 x 1] + 25 = $73
Upside: $33
Downside: $10 (I would set the stop at $30…good support at $31 – $32)
Reward to risk : 3.3 : 1
This is still a good trade at these levels.
Finally, price objectives are not set in stone. They can change depending on the pattern and price of the stock over time. But, they do give you a framework on which to analyze a potential trade.
If you’re shorting a stock, the methodology is just the opposite. I can give an example of that in a future post, if anyone would like to see it.
Using Point and Figure charting is not about picking tops and bottoms. It’s about buying (or selling) based on trends in supply and demand. This can be an additional tool for trend followers.
Disclaimer: This information is not intended to be used as the primary basis of investment decisions. Because of individual investors requirements, it should not be construed as advice designed to meet the particular investment needs of any investor. Consult your financial advisor prior to taking any actions. The information and opinions contained here are those of the author and are not necessarily the same as those of iBankCoin, its principals or its affiliates. The author may have a position in one or more stocks mentioned here. Trade at your own risk.
Comments »