iBankCoin
Joined Jan 1, 1970
509 Blog Posts

Bought TTEK @ $24.92

This one kept nagging me to buy it. When Woody posted it on his “Daily Breakout” list, that was the final straw. I bought [[TTEK]] @ 24.92, adding it to my Alpha stock positions.

ttek051608.png

Highlights:

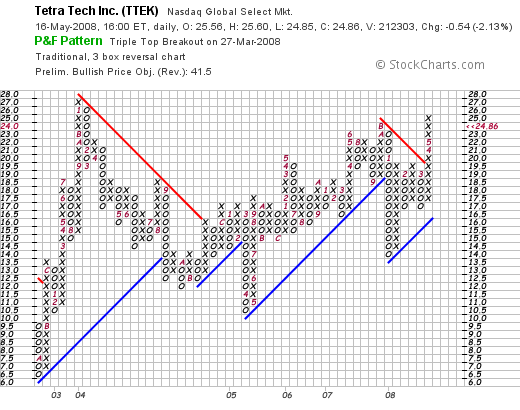
Technical: Bullish. Triple top breakout hit at 25. Bullish price objective is 41 – 42.

S&P Sector: Industrials

Industry: Pollution Control

Investment Thesis: Q2:2008 exceeded expectations. Their backlog of projects is forecasting better results to come. TTEK is showing strong business in all of their key markets. Management’s near term guidance was increased slightly. However, they experienced a record level of bookings.

The backlog increased 39% Y-O-Y to $1.5 B.

Federal government revenue grew by 26%, State and Local by 10% and Commercial by 22%.

A key component of growth in the Commercial business was  due to wind power insfrastructure projects.

Background: Tetra Tech, Inc. provides consulting, engineering, and technical services focused on water resource management and civil infrastructure.

It offers research and development, applied science and technology, engineering design, program management, construction management, and operations and maintenance services.

The company operates in three segments: Resource Management, Infrastructure, and Communications. The Resource Management segment supports high priority government programs for water quality improvement, environmental restoration, productive reuse of defense facilities, and strategic environmental resource planning. Its service offerings are focused on surface water, groundwater, waste management, project management, and regulatory compliance. The Infrastructure segment develops water infrastructure projects; institutional facilities; commercial, recreational, and leisure facilities; transportation projects; and systems and security projects. The Communications segment delivers technical solutions necessary to design and build wired communications infrastructure projects. Its services include engineering, permitting, site acquisition, and construction management services to state and local governments, telecommunications companies, and cable operators. Tetra Tech’s customer base includes federal, state, and local government agencies, as well as commercial and international clients. The company was founded in 1966 and is headquartered in Pasadena, California.

Disclaimer: This information is not intended to be used as the primary basis of investment decisions.  Because of individual investors requirements, it should not be construed as advice designed to meet the particular investment needs of any investor. Consult your financial advisor prior to taking any actions. The information and opinions contained here are those of the author and are not necessarily the same as those of iBankCoin, its principals or its affiliates. The author may have a position in one or more stocks mentioned here. Trade at your own risk.

Comments »

Morning Routines

What’s your daily “routine” like? By that I mean, what are the things you do every morning when you start your day? I’m talking about pre-market opening stuff, not the “I get up, take a piss, scratch myself and grab a cup of coffee” kind of stuff.

Do you even have a routine? Are you up at the same time every morning? Do you do the same things to start your day, day after day? Or do you simply fall out of bed, splash cold water on your face and lazily make your way to work or the computer in a stupor?

What I’m talking about are the things that you do consistently, day in-day out, that keep you on track. I would say that the vast majority of successful traders and investors have a specific set of things that they do each morning, in sequence, as they begin to assess the market prior to the opening.

Much of my pre-market routine actually starts the night before.

1. I review market activity; what happened for the day; I look at the NYSE and Naz action to get a feel for what may happen during the next trading session.

2. Then I check the business and world news headlines aftermarket and in the evening; I also make note of any aftermarket earnings releases. (As an aside, one thing that I do on weekends is enter on my calendar, the economic data releases and companies that are reporting earnings for the coming week, that I have positions in. This is not an option. I look at this as a “must do” if I want to stay on top of the market.)

3. I then view my updated portfolio(s) each evening, looking at the price action on my positions and determine what actions I may want to take for the next day, if any.

4. Next come the charts. Charts on the indices. Charts on my positions. Charts on my candidates list. Charts on Dow stocks. Lots of charts (PnF) to get a feel for the supply and demand forces in the market.

[For you dedicated chart chompers: ….Someone once told me that you really don’t develop proficiency and expertise in trading until you’ve viewed at least one million charts! I know of one trader that looks at the charts of every stock in the S&P 500, every day! Sometimes 2 times a day. If you spend an average of 20 – 30 seconds on each chart, looking at the price levels, gauging support, resistance, breakout points, breakdowns, etc. …do the math. How much time would you have to spend in a day to look at all 500 stocks in the S&P? About 4 -to 5 hours, right? That’s pretty extreme. Most of us are not that dedicated (or obsessed) with our craft. Think about it. Five hundred charts a day, about 300 days a year. That’s 150,000 chart views a year. At that level, you’re looking at 6 to 7 years before you hit a million charts viewed. But can you imagine the kind of proficiency and pattern recognition you’d have on about 500 stocks?]….

My morning routine looks like this:

1. I check the overnight news. What happened in Asia? Europe? What are the futures prices doing? What are commodities doing?

2. I take a look at the sector activity. One simple way is to analyze the sector ETFs like I outlined in a post earlier yesterday.

3. Also look at the market breadth. I like to compare the relative strength (RS) of the cap weighted S&P 500 index vs. an equal weighted S&P index. You can do this by simply comparing SPY vs. RSP for relative strength.

4. Which market cap is more favored? Which one shows the highest RS? Large, mid, small?

5. Which style is more favorable? Growth, value, blend?

[Right now, Mid Cap Growth is showing the highest RS, followed by Mid Cap Blend and Large Cap Growth. Taking into account the favorable sectors, you can then narrow things down to the stocks within a sector that show these favorable style characteristics. That is how I do it. I’m not saying it’s the best way. But, it works for me.]

6. Finally, I look at the global picture. Where is capital flowing to? Which region? Which country? Again, the beauty of ETFs is that you can now track and analyze a specific country index. Without going into it, right now….Emerging markets, especially Latin America look the strongest.

Happy Friday.

Comments »

Update: Alpha’s 21

Here’s an update on the new group of Alpha stocks I bought on 05/12/08, and [[GLW]] on 05/13/08 @ 25.74.

Yesterday, I added [[BIG]] @ $29.05 (05/14/08).

This rounds out the “21”, with the current prices and purchase prices shown below.

[[AGU]]@86.26

[[AKS]]@68.99

[[BIG]]@ 29.05

[[CLF]]@89.40*

[[CLR]]@51.90

[[CNX]]@91.41

[[EAC]]@55.52

[[FDG]]@69.30

[[FLS]]@121.10

[[FTI]]@75.48

[[GLW]]@25.74

[[MA]]@291.75

[[MEE]]@58.50

[[MOS]]@126.98

[[MTL]]@156.32

[[PBR]]@65.55

[[POT]]@199.26

[[SGY]]@67.39

[[SID]]@47.44

[[WFT]]@83.98

[[WLT]]@83.87

As a group, they were up 2.11% today (05/15/08).

* [[CLF]] adjusted for recent 2 – 1 split.

BONUS:

Can you stare down Jessica Alba?

[youtube:http://www.youtube.com/watch?v=zmzcKXsllWs 450 300]

Comments »

Sector ETFs: Technical Update

General Market Technicals:

Overall:

bull21.jpg

The market continues to be in bullish mode. Currently over 52% of stocks on the NYSE are trading above their 50-day MA. This number was 51% last week, and 43% four weeks ago.

Take note that the NYSE stocks briefly flirted with overbought levels last week, as 72% of stocks were trading above their 10-wk MA (70% and higher is overbought). That number has backed off to 69% today.

However, there is still more potential for upside,  as only 50% of stocks on the NYSE are trading above the 30-wk MA.

On the OTC, 37.5% of stocks are trading above their 50-day MA. This number is unchanged from last week.

Sector Focus:

Consumer Staples [[XLP]]: Neutral. It had been in a long term bullish uptrend, but since Mid-January, has been moving sideways with a slight bullish bias. From a recent low in March, it has reversed to the upside. A move above $30 would resume the bullish trend.

Consumer Discretionary [[XLY]]: Neutral, with a bullish bias. Consolidating. An intraday move to 34 initiates a bullish double top breakout .

Energy [[XLE]]: Bullish/Neutral. Double top breakout was at 86. Extended and vulnerable to a sell off, however. Momo players proceed with caution. Potential to short names in this sector.

Financials [[XLF]]: Bearish pattern, consolidating. Strong resistance to the upside in this trading range up to 28.  A break above 30 would initiate a double top breakout pattern, but still a long ways off. Support at 25. Look for short ideas in this sector.

Health Care [[XLV]]: Bearish. Double bottom breakdown pattern. Support is at 30. A break below could eventually take it down to 23. Look for short ideas in this sector.

Industrials [[XLI]]: Neutral. Bullish pattern, consolidating. Extended long term. Vulnerable to a correction. Bulls, I wouldn’t get excited about it until it approaches 41. A move to 42 would initiate a triple top breakout. Keep it on the radar. Support down to 37.

Materials [[XLB]]: Bullish. Double top breakout. Has broken out to new highs after long period of consolidation from 39 – 42. Looking a little extended, however. Strong support at 40 – 41.

Tech [[XLK]]: Neutral, bullish bias. Consolidating. On the watch list. A move to 28 sets up a potential bullish breakout. But, this one needs time. Support at 20 – 21.

Utilities [[XLU]]: Bullish. Breaking out after period of consolidation. Strong support at 39.  

Telecom [[IYZ]]: Bearish. Recently reversed, but still bearish overall. Risk:  sell-off to 22.  A break below 21 doesn’t see support until 19.00 – 19.50.

Each day, I take a look at which sectors are doing well, bad or reversing. From that information, I look at stock ideas in each sector for long or short ideas, based upon which way the tide is moving.

Disclaimer: This information is not intended to be used as the primary basis of investment decisions.  Because of individual investors requirements, it should not be construed as advice designed to meet the particular investment needs of any investor. Consult your financial advisor prior to taking any actions. The information and opinions contained here are those of the author and are not necessarily the same as those of iBankCoin, its principals or its affiliates. The author may have a position in one or more stocks mentioned here. Trade at your own risk.

Comments »

Oil Mania

Even with the slight drop in oil prices today, at $124 / bbl, oil still remains more than two standard deviations above the long term price trend. So, statistically speaking, the price will eventually revert to the mean at some point, probably sooner than later.

Global energy demand is weakening, supply is rising, the Dollar is starting to rally and….

……….oil prices go up? WTF?

This egregious rise in prices, if allowed to continue, can sink the general market. History has shown this to be true in any extended oil price cycle. About the only beneficiaries will be energy companies, much to the chagrin of the other sectors.

Caution advised.

Developing…………

Comments »

Mid-Week Stock Ideas

More new stocks are coming up on my proprietary “Alpha” screen.

Some interesting names I’ve sniffed out……

Consumer:

[[DV]] @58.10; [[BIG]] @ 29.05 (bought some today)

Energy:

[[PCX]] @ 78.78 (spin-off from [[BTU]] )

Financials:

[[SF]] @ 52.33

Industrials:

[[MEA]] @ 15.50; [[UFPT]] @ 13.17; [[RBN]] @ 42.84; [[JEC]] @ 94.22.

All these are looking attractive. 

Disclaimer: This information is not intended to be used as the primary basis of investment decisions.  Because of individual investors requirements, it should not be construed as advice designed to meet the particular investment needs of any investor. Consult your financial advisor prior to taking any actions. The information and opinions contained here are those of the author and are not necessarily the same as those of iBankCoin, its principals or its affiliates. The author may have a position in one or more stocks mentioned here. Trade at your own risk.

Comments »