Yesterday evening, Frank Zorrilla @ZorTrades and I shared a few tweets where we discussed the use of Bollinger Bands (50,2) to time various market constituents. The conversation turned to Gold, and since I’ve been considering establishing a position, I thought it would be a good time to run a few tests. Frank agreed.
Unfortunately, the $GLD ETF does not have a great deal of history with which to test, so I’m going to use 2 proxies: $GOX (CBOE Gold Index) and $DJPR (Dow Jones UBS Precious Metals Subindex). Clicking on that last link will take you to a chart that allows a comparison between $GLD and $DJPR. They have tracked each other fairly close over the last year.
Although there are many different ways to assess whether Gold is a buy or a sell here, Frank and I were talking about using Bollinger Bands (50,2). Setting Bollinger Bands to (50,2) is a favorite of mine, especially as an abnormal market indicator. $GLD has closed beneath its lower Bollinger Band for the last 5 closes. Today, both $GOX and $DJPR closed for the 4th consecutive day beneath their lower Bollinger Bands. This is very significant. More about that in a bit. Let’s get to testing.
The Rules:
- Buy $GOX or $DJPR at the Close when it has Closed beneath its lower Bollinger Band (50,2)
- Sell X days later
- No Commissions or Slippage Included
- $GOX history starts on 4.22.1996
- $DJPR history starts on 1.2.1991
The Results using $GOX:
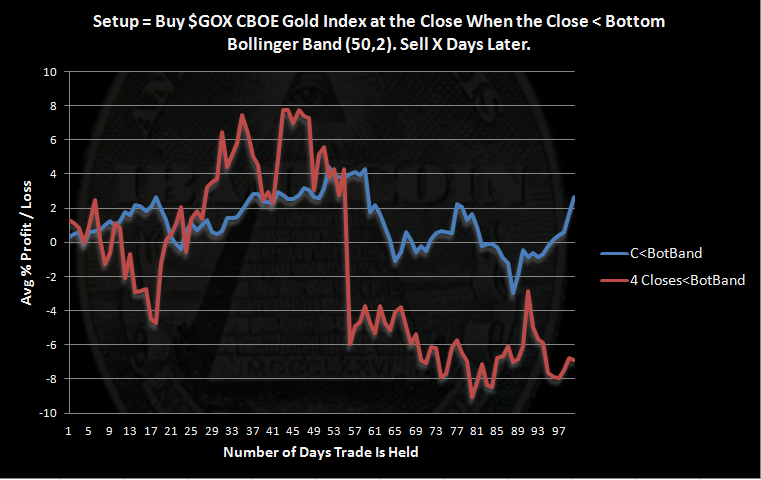
- There were 128 occurrences of this setup with 21 trades held the full 100 days. (Blue line)
- There were only 10 occurrences of $GOX making 4 consecutive closes beneath its lower Bollinger Band, with 6 held the full 100 days. (Red line)
I don’t see much to get excited about. It is a rare event for the index to make 4 consecutive closes beneath its lower band. When the index closes one day beneath the lower band and then quickly reverses to close above it, results are mildly bullish. Multiple closes beneath the lower band are telling us that something abnormal is happening. A bounce will eventually occur, but the results above show that on average, the index slid for over 3 more weeks before the bounce.
Let’s take a look at the results using $DJPR:
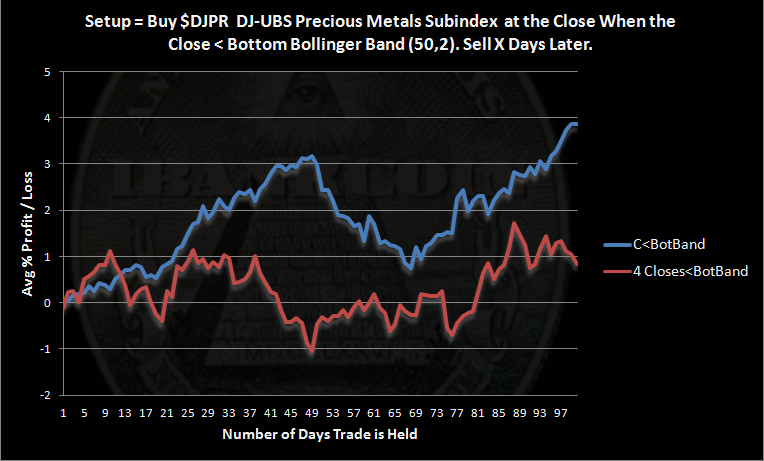
- There were 163 occurrences of this setup with 30 trades held for the full 100 days. (Blue line)
- There were 19 occurrences of 4 consecutive closes beneath the lower Bollinger Band, with 14 trades held for the full 100 days. (Red line)
The results leave some things to be desired, like profits. Again, one close beneath the lower Bollinger Band seems to be a fairly normal occurrence, and we can see some reversion to the mean takes hold, with average gains of 3% after 50 days. However, four consecutive closes beneath the lower band is not normal, is rare, and seems to indicate that a new trend is emerging or has emerged.
Based solely on the above analysis, I’m not comfortable establishing a position in Gold. Bollinger Bands (50,2) work well to show that a strong trend is developing when $SPY closes above them. It is not difficult to understand that consecutive closes beneath the lower Bollinger Band seem to indicate that at best, Gold will languish and trade sideways over the intermediate term. At worst, this setup may signal a new downtrend is emerging.
As noted above, this is only one study. Perhaps over the weekend we can examine the impending death cross in Gold. If there are other tests you would like to see run on Gold, let me know in the comments section. I can’t promise anything, but if you come up with something interesting and I can code it, I might give it a shot.
Comments »