We are finally seeing a little pullback after a solid month of rallying. The pullback is still pretty cute and has not turned ugly, although it has one of my indicators flashing a rather extreme signal. The indicator of which I’m speaking is the Decliners indicator.
This indicator simply counts the number of declining stocks with a close greater than 1 buck, 50 day average volume greater than 100K shares, and a 50 day average dollar volume greater than $1,000,000. It then ranks this count against all the previous counts over the last 250 days.
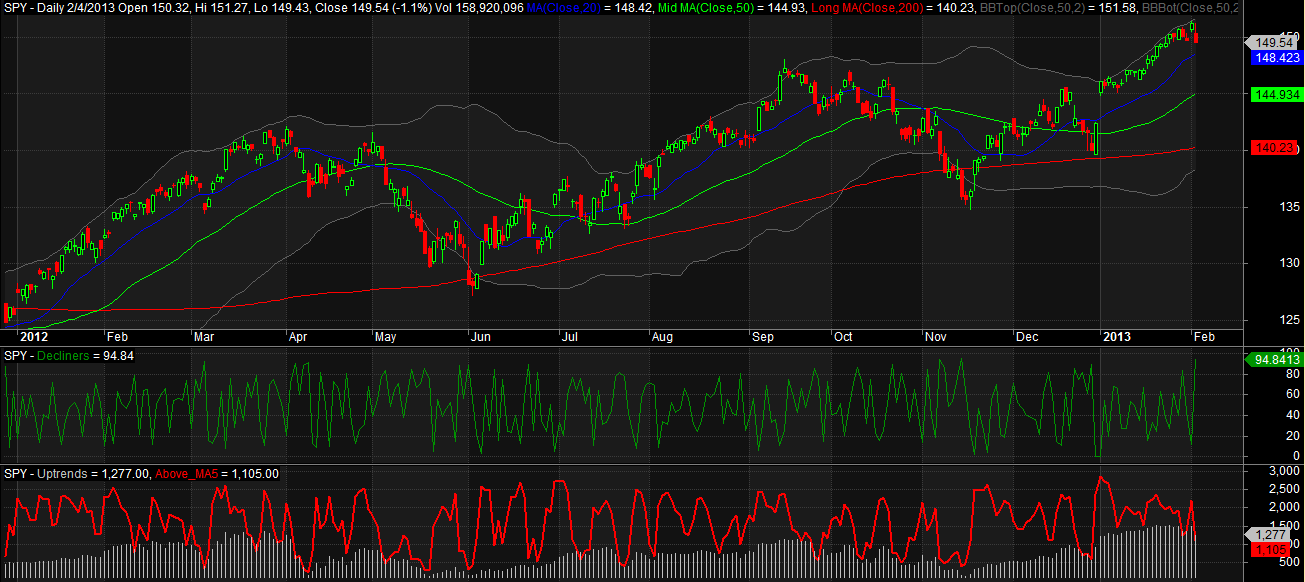
The Decliners indicator is the middle pane, green line. It closed this evening at 94.8. Click on the chart to enlarge it.
So what happens when we buy $SPY the next morning on the open after the Decliners indicator registers a close above 90?
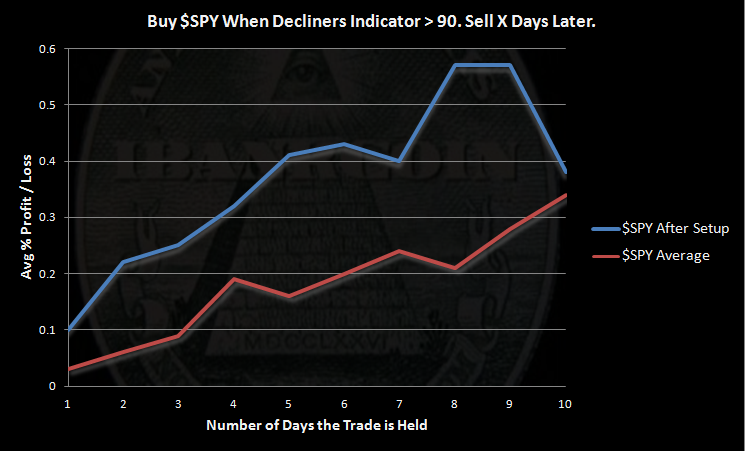
The $SPY After Setup next day return is more than 2x better than average and results improve going forward. We see that by the 10th day, the edge is wearing off and $SPY average performance is catching up.
One important caveat about the Decliners indicator is that the edge can come and go very quickly. One of the other breadth indicators I use tends to portend a bounce that lasts longer. This is the number of stocks above their 5 day moving average. It is the indicator in the lower pane, red line. It has not yet fallen far enough for me to expect this bounce to last awhile. What this tells me is to expect a bounce, but do not expect it to last a long time. We may be setting up for a test-the-recent-highs situation before embarking on a more meaningful pullback.


Yep.