As many of you know, I made the decision to undergo a difficult project to try to convert some of OA’s teachings into code.
Along the way, I abandoned the project after I could no longer update the data with a single push of the button due to finviz automatically redirecting the page which would export to a sign-in/register/pay us money page.
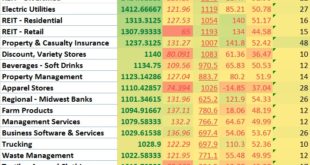
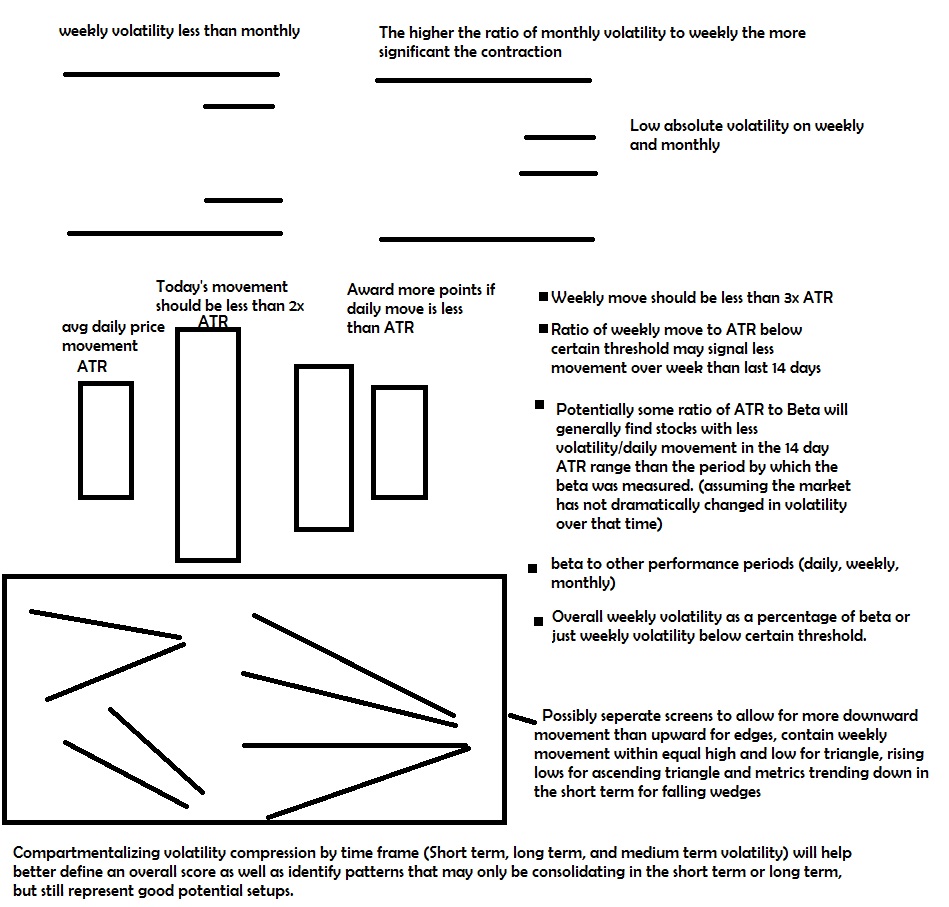
The main focus was on volatility contraction and scoring a stock’s classification according to it’s own movement.
The next stage was to use industry metrics as well as location, sector & market cap size metrics to apply a bonus to those in an industry or theme that was “working”.
I also applied a bonus to stocks that were undergoing significant volatility contraction.
An additional bonus was layered for “themes” that were all showing significant scores (and likely saw significant volatility contraction as a group as well)
—-
The next stage which I had begun working on was reclassifying stock according to how it performed relative to the industry.
After taking much time away from the market followed by some time trading without this spreadsheet functioning, I have made the decision to find a work around and get back to it.
With a fresh set of eyes comes a new perspective.
First,
The formulas got too taxing to make adjustments, especially if I want to make quick, temporary ones. I had so many formulas on top of formulas that I lost track at times of what the numbers in the formula meant. That made things very difficult to change.
The solution to that will be to create a tab separately for adjusting the amounts in the formula and explaining in English what the formula does. This way you can tweak a number on the formula page and it will automatically adjust without having to re-copy and paste the formulas and adjust the entire formulas.
Secondly,
While determining how stocks in a particular “theme” are doing relative to each other is useful, I need to do more to classify the “risk” level of a stock. Certainly determining whether a stock is consolidating off it’s 52 week high or 52 week low makes a difference in the “look” you are going for and what type of qualities you are looking for. However, I need to better fine tune definitions with seperate metrics that score the “risk factor” of a stock, it’s industry average and how it relates to it’s industry average (as well as other areas it may have in common with other stocks), to come up with an overall weghted average that converts to a 1-5 score.
I also want to use earnings data to sort of be able to X out stocks that have earnings coming up in X days.
Finally,
I want to either possibly run some kind of beta test and invite all the IBCers to try it free for some time, and/or possibly even build it live, explaining the details of what I’m doing and effectively making it open source.
———————
Less importantly, I will no longer need the sort of time sensitive data since I won’t be able to use it as efficiently as I would have hoped.
I had worked on breadth statistics of groups to try to find the stock in a group that wasn’t moving when the group was, and also try to classify where the group was in the “risk cycle”.
This was most useful for stocks in larger industries, but I’m going to focus on being productive and ignore the more taxing parts of the projects for now.
———————————

If I happen to finish these steps, the next priority will be to try to “normalize” the scores from -100-100 or -1000 to 1000 or something, and then try to make a very rough price projection.
The price projection is not expected to be accurate, but instead useful to help determine the larger rotation of where the capital is headed now, and what those movements will mean for the setups next.
The idea will be to be able to have ONE dimension of metrics based on the here and now, and another dimension of metrics based upon the anticipated movements….
In other words, what happens IF the price action occurs as projected? How does that change the scores of all of the stocks, and what’s the result of the next projection and the next one.
If a stock is consolidating, a 1-3 price move influenced by capital flows into the industry or related elements could be enough to give it the boost to understand when to expect a breakout, and a second iteration of that combined with the 5-10 day look would allow you to look forward and finetune the “YOLO” trades a bit more accurately as well as get a better picture of which 5-10 day moves are likely to fizzle, and which will do well.
The 1-3 strengthens the 5-10 day projection and narrows the timeframe, as well as helps filter the 2nd and 3rd iteration to eventually a 30 day projection
Without the time sensitive data being timely available–that influences the 1-3 day projections–in this next version, I’m probably going to instead focus on ~5-10 day projection as the shorter term and ~10-20 as the longer term and have a couple iterations forward to give me about a monthly projection, and maybe a few monthly projections to give me quarterly, and a few quarterly projections to give me a year projection.
The idea of being able to project some of the best OTM LEAP option purchases and quickly identify the run away trending stocks before they happen is very intriguing to me, but I wish I had some of the shorter term “character” movements that help anticipate sort of the breakout and fizzle, break and chase, fake out and break out, and the false moves to fast moves that really better help define what to expect and how to handle it.
Unfortunately it takes a very long time to set up the calculations of how breadth within an industry and volume within an industry compares to the individual stocks and then looking at which moves are lagging on the days and weeks and determining which stocks are working in the cycle and which are next… and it can only really be used for industries with the greatest number of publicly traded stocks; which is about 10% of the market.
So this time around, I’m probably not using it.
If you enjoy the content at iBankCoin, please follow us on Twitter