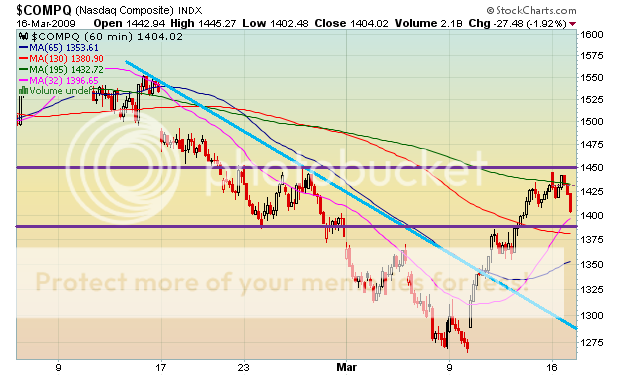
Yesterday was a reversal day and I am now greater than 20% short in the financials and small caps. I put equal weight on reversal candles, moving averages, trends/channels, support/resistance, and price/volume action to determine whether I scale-in more positions.
We had the rare gravestone doji yesterday and various shooting stars, that have either formed right at the 20- or 30-day MA’s and have also hit resistance, with most indices at the November low retracement. The COMP has shown a divergence and it has formed a quasi evening star reversal.
The obvious question is, ‘Will this be a normal pullback or is this the start of a breakdown?’. The answer is, ‘I probably wouldn’t get any signals until Wed’. Why? Because typically, a upside reversal candle such as doji or hammers precede the continuation of a rally. In a downside breakdown pattern, you’ll see solid red candles with larger volume on the sell-off. The key here is the volume. Low volume should accompany pullbacks and the opposite is true for sell-offs (higher volume).
A great way to confirm any short-side thinking is to look at the inverse ETFs, 2x and 3x, and see if they exhibit reversal candles on support levels or moving averages and are accompanied by higher than average volume. For example, if I wanted to short financials, I would look at FAS, FAZ, UYG, SKF, XLF, and their top main components to see what the odds would be if I decided to short. In most cases, there won’t be any divergences, but if there are, then I have to consider why.
I am looking to swing the shorts and then the market determines what action I take next. Below are 40-day and 5-month charts for the SPX, DJIA, COMP, and RUT.
If you enjoy the content at iBankCoin, please follow us on Twitter


CA – a question regarding shooting stars as in BKX & BAC, or a gravestone doji as in NDX : Which is more bearish? Or it depends on volume as you’ve stated?
Hello Mr CA,
May I be so bold as to ask what deck do you study?
I’ve been studying the Jungian Tarot for over 15 years.
Just started another 22 week course on the Major Arcana.
Powerful stuff.
Thanks CA, fantastic piece, I am so in the zone right now it is scary, i have got to reign it in a bit while I am so ahead, hubris is a killer
I actually don’t do tarot, it was a joke. People always tell me that technical analysis is akin to palm reading, tea leaf reading, black magic, voodoo, etc.
Juice, both are bearish signals, but they have to be accompanied by the volume. We have no volume right now.
ex- it’s tough to keep restrained. I like to go run a few miles to calm the f down.