As I posted on October 28,2011, I entered a position in TZA. I posted the reasons and some additional thoughts in my previous blogs. I suggest you read those first if you have not done so before.
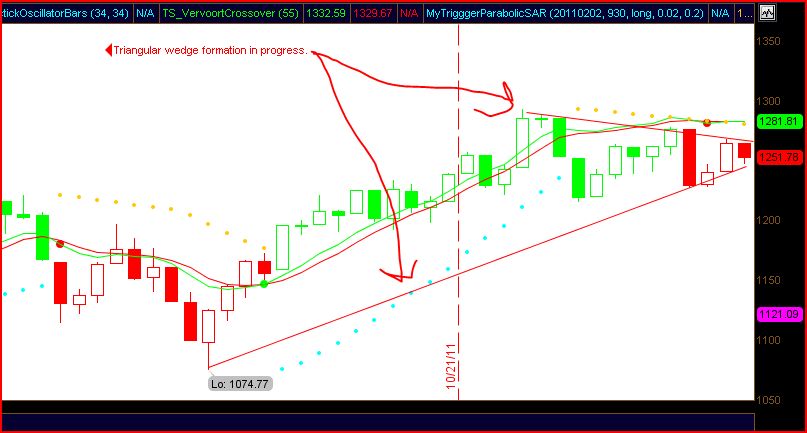
Here is what has happened in the SPX since. The entry point is where the upper arrow points:
And here is what has happeend in TZA since:
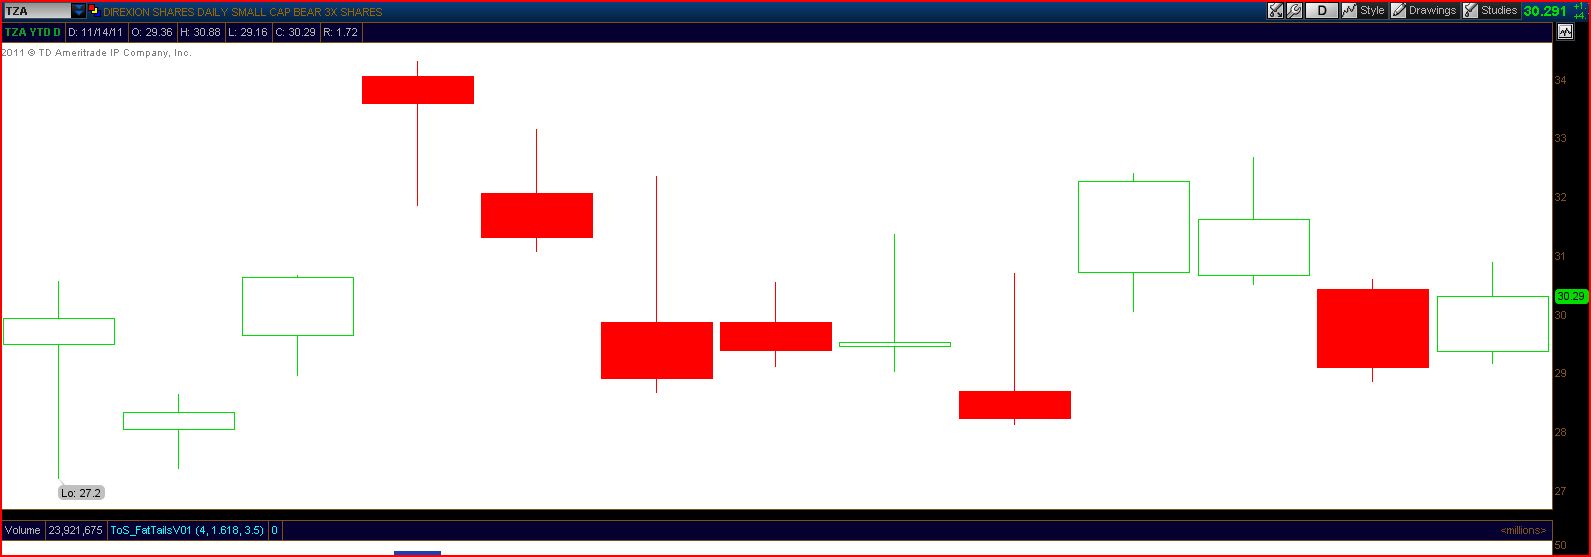
As you can see, the S&P is down slightly, and TZA is up slightly. So far, so good, a gain is a gain. I have been trading in and out of it to lower my basis, but TZA is my core position for now.
As I said in my previous posts, a prime reason for entering the trade was my perception of events in Europe. Put another way, it is my impression that the European Union in its current form is unsustainable and unraveling. However, as Keynes said, there is a lot of ruin in a country, and I’m sure even more so in a multi-country Union. So, I expect things to take time to develop. We’ll still be talking about Europe’s problems in 2012, and 2013, and 2014. They are not going away. Eventually it will have to break up or become more like the the United States, with fiscal and monetary policy in the same hands. I think the former outcome much, much more likely. The countries of Europe simply value their sovereignty too highly, a problem the US did not have when it formed a more cohesive whole. Plus, many of those countries have bad historical associations with Germany, the country destined to be a prime leader in any tighter union due to its economic power and influence.
But that’s the macro reason. I also think the US market is simply ready to see lower valuations. There is a very strong opposing viewpoint that says companies are making good profits and in fact, by historical standards, are under-valued. How you view that sort of thing depends on what yardstick you use. I don’t care what the average S&P 500 P/E ratio is over the last five or ten or 50 years because it fluctuates continually based on market conditions. It is like saying you think the Euro will go down tomorrow because it is currently trading at $1.36, while over the last ten years it has averaged $1.31 (or whatever that figure may be). You will go broke thinking like that. There is no “average” figure that has any meaning. Whether that current ratio, whatever it is, is going to rise or fall depends completely on macro economic conditions and investor reactions to those conditions, like it or not.
You will see people justify buying the market now based on these meaningless historical measures. My viewpoint is that wherever the ratio currently stands is a fair value for this moment in time. What we are interested in is the NEXT moment of time and what values will be then. Future valuation depends on investor psychology, which derives from macro economic events. Whether you make money on your trade depends on these fluctuations, unless you are interested in a buy-and-hold strategy over a period of years and ready to wait until that psychology just so happens to change in your favor, in which case you most assuredly should not be investing in TZA or anything similar. “Historical valuation” thus is a completely nonsensical idea, except in the very broadest of terms, and we are in the middle of a very broad range.
The bottom line is that the economy right now is extremely fragile. Europe is going into a recession, everybody pretty much accepts that. Austerity budgets required by the European Union in Italy, Greece, Spain, Ireland and elsewhere will see to that. The United States is not an island, and if its largest trading partner has economic troubles, it is not going to sidestep them. Combine that with the need for austerity in the United States as required by current budget laws soon to go into effect, due to decades of profligate spending and borrowing, and you have the makings for at the very least an economic slowdown, and quite possibly another recession.
Anyway, that is the overview. The chart I posted above shows a triangle formation that is very near its conclusion. Either we break up, or down, and it will be a hard break. As I posted in a previous blog, my expectation is that it breaks lower. However, it may go the other way, in which case I am out of the TZA position completely.
But so far, the position is working. The market tone has changed completely since October. Monday’s action was an inside day, a Bearish Harami pattern. If we get continuation, we could easily get a real breakdown to the S&P 1200 level or lower. We play it by ear once we start moving one way or the other.
Be ready. Soon it is time to make the easy money.


One Response to “Update on the TZA Trade”
Waterlogz
I sold out for a small gain. I am thinking about buying back in just before turkey day.. Hows that for reading the charts. I call it a turkish candle…lol