The strength of this Bear Market rally has been fierce. It is like the vampire who keeps rising from his coffin, only repeated applications of silver bullets will send him back for good. This week, we have another collection of such bullets.
Looking at the charts, once again we see some distinctive patterns. Chart analysis is as much an art as it is a science, because two people of equal charting skill can see different things in the same chart. Few patterns are perfect, and thus they are open to some interpretation. The wisest thing is to compare other technical indicators and chart patterns with Candlestick patterns to reach some kind of conclusion. Even then, we are just talking about increasing the odds of deciphering future market trends. Nothing is certain.
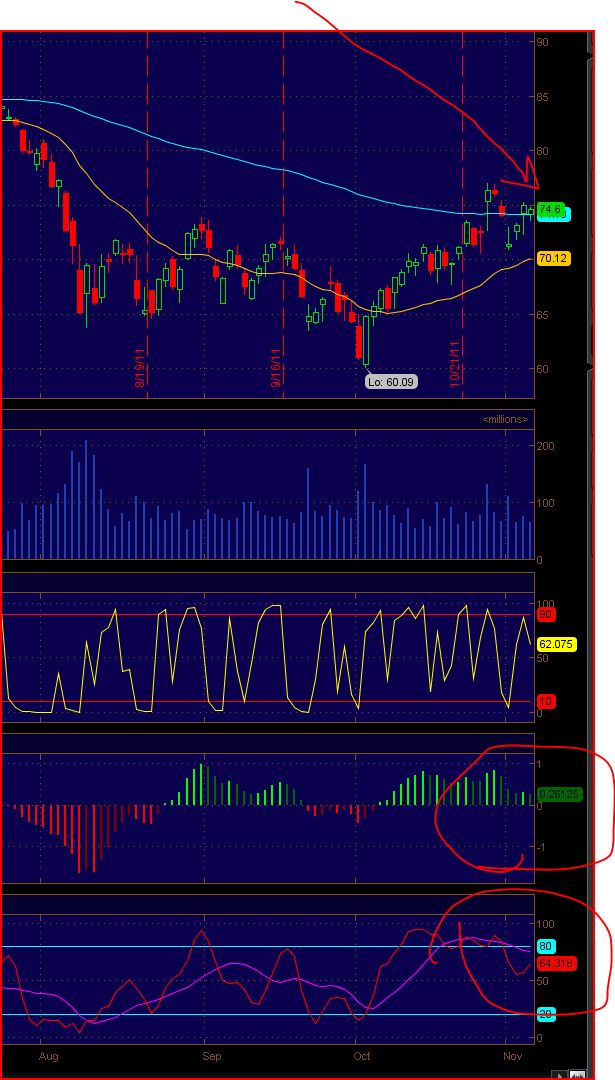
That said, the charts aren’t just speaking this week, they are shouting. Let’s look first at the SPX daily.
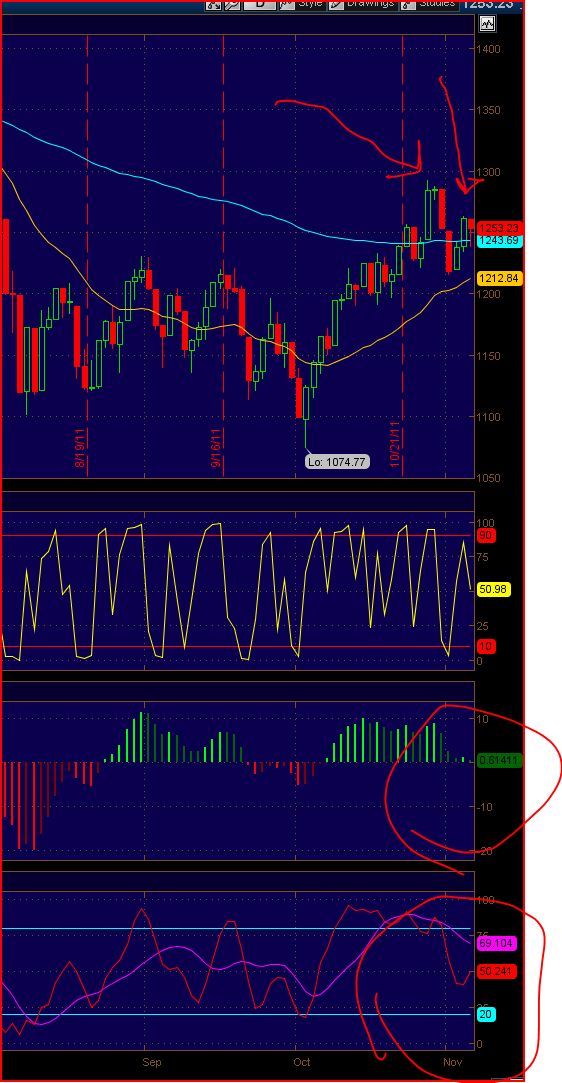
Last week, we had a Doji to end the week. That is the Candlestick I pointed to on the left. Now, some didn’t think the tails were big enough to make it a Doji, but I did. A Doji after a big rally is a reversal indicator. Sure enough, the market reversed on Monday and Tuesday, taking the market down. Call it what you will, it did what a Doji is supposed to do.
This week ended with a Hanging Man. That is the Candlestick on the right. This also is a reversal pattern. A reversal pattern such as a Hanging Man does not mean that prices necessarily will reverse, but only that the trend will change. Since the trend the last couple of days, and indeed for the last month, was up, that implies we move either sideways or lower.
Reversal patterns need to be confirmed. If Monday’s action is down, we will have good confirmation. For now, I note the technical indicators which I circled which suggest a decline is coming.
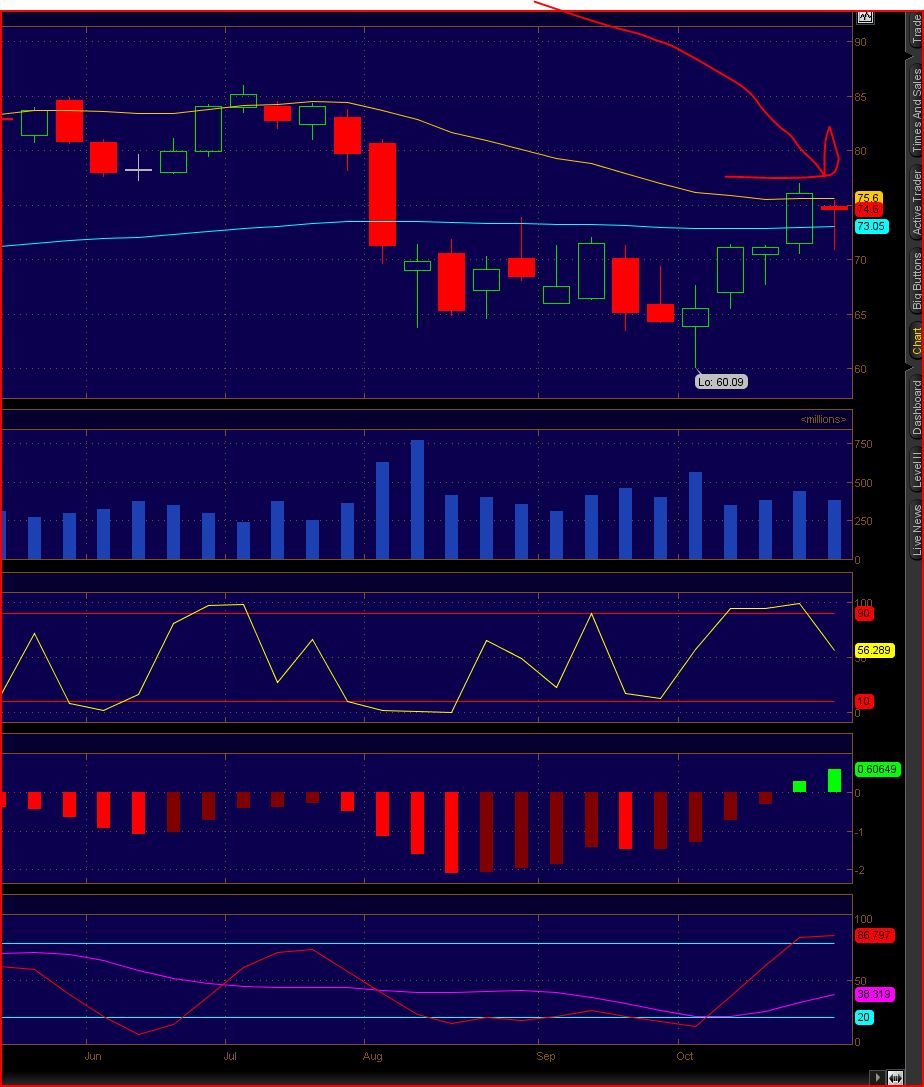
For additional confirmation, let’s look at the SPX weekly chart:
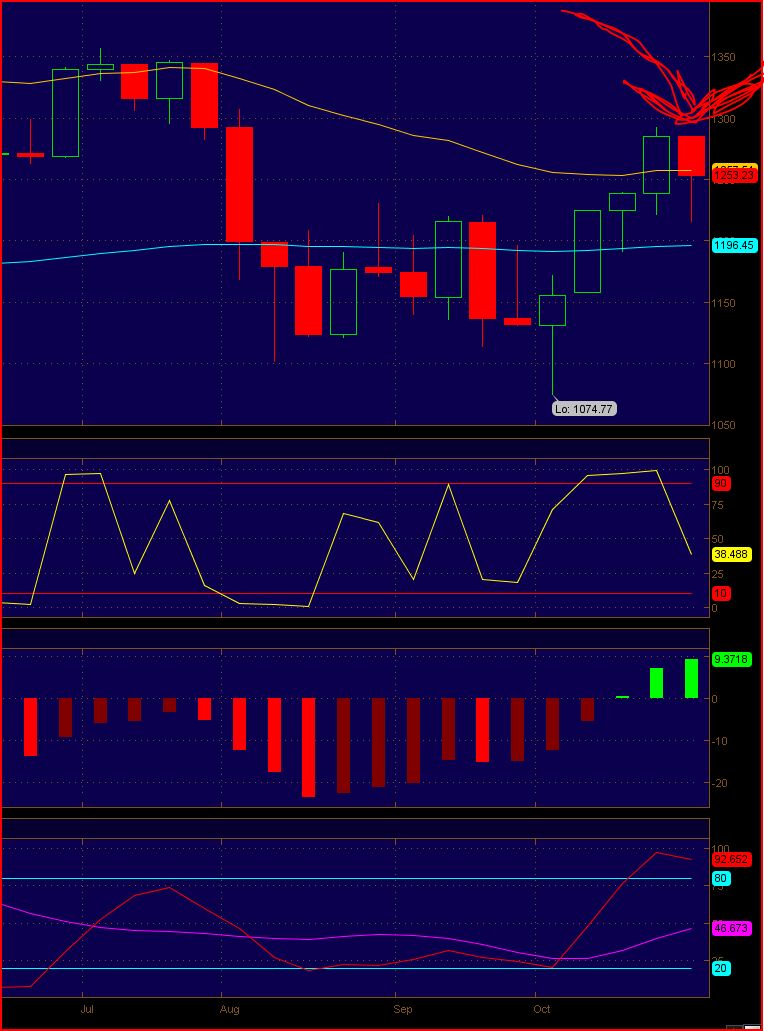
We also have a Hanging Man here. The three requirements of a Hanging Man are: 1. the real body is at the upper end of the trading range; 2. There is a long lower shadow; 3. There should be little or no upper shadow.
I think this meets those criteria. Technically, the lower shadow should be twice the height of the body, and that is not the case here, but it is close enough, and besides, we are only using this as confirmation. In any event, it looks like we either go sideways or down next week, at least early in the week.
Next, let’s look at the COMP:
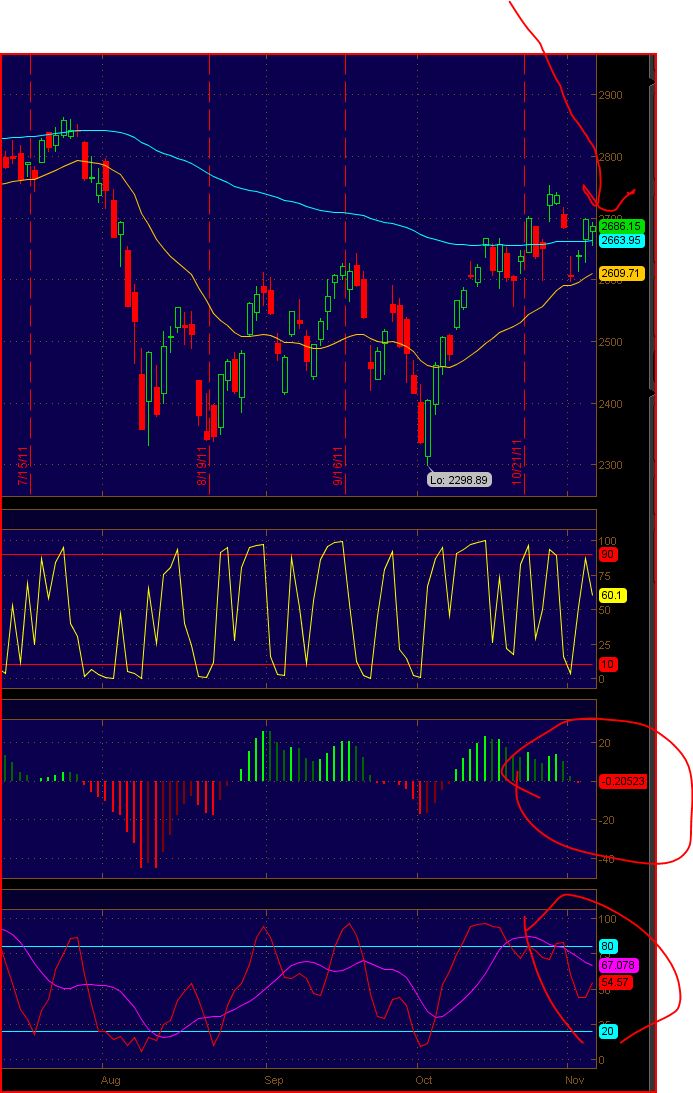
On this post, there was no Doji last week. The market fell off on Monday and Tuesday anyway. We do, though, have a nice Hanging Man to end this week. If anything, the technical indicators are even more clear as confirmation that the market is weak and ripe for a fall.
Let’s turn to the COMP weekly for confirmation:
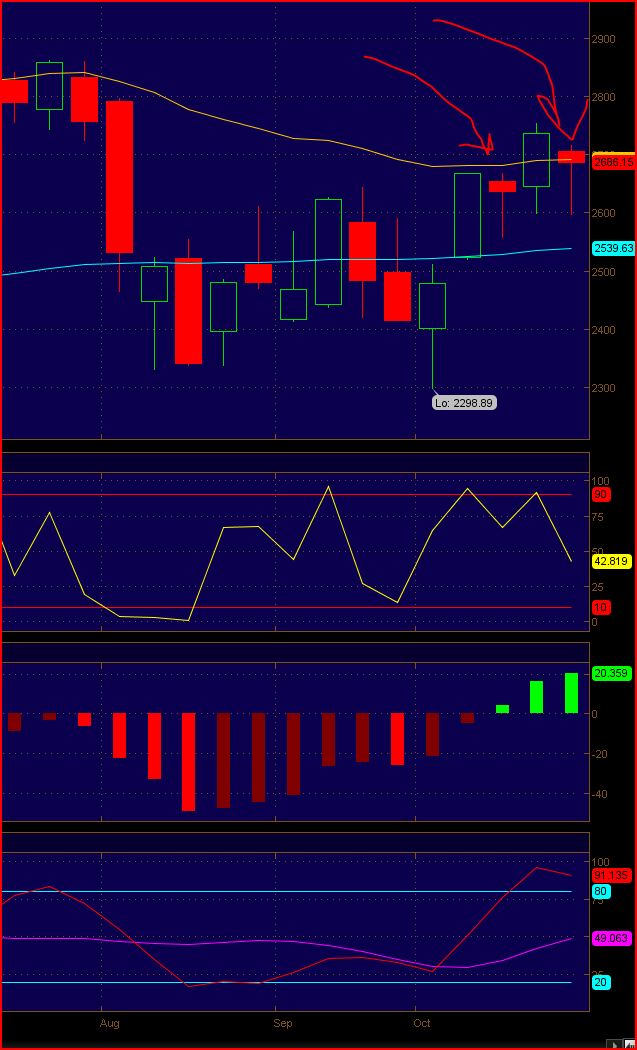
On this chart, we also have a Hanging Man. It looks like we also had one two weeks ago, but that one failed. The important thing to remember is that we need confirmation for a reversal pattern to have any meaning. The other technicals are mixed and of little value. That is why price action next week is so important. However, two Hanging Men in three weeks is more evidence that something is up in the market that easily could lead to a trend change here.
Next, the Russell 2000:
As you can see, we also have a Hanging Man to end the week. The technical indicators are not quite as ripe as for the other two averages, though. The small caps have shown strength in the market recently. It is unlikely, though, that they will overcome an overall trend change.
Let’s also look at the weekly for the Russell 2000:
Unlike the daily charts, this one looks less like a Hanging Man than it does a Doji. Either way, though, the result is the same – it signifies a trend change. It does not automatically mean we will go down next week, but it does serve to confirm the Hanging Man on the daily chart. The technicals on this chart are not nearly as ripe as on the other charts, so this one is less certain.
I could go through some more charts, but they tend to say the same things. The point is that the charts are trying to tell us something here, if only we are able to understand.
There is an army of Hanging Men. Ignore them at your peril.


5 Responses to “An Army of Hanging Men”
Woodshedder
Good chart chomping Slayer.
TheSlayer
Thanks. 🙂
alf44
I love the smell of “Hanging Men” … in tha morning !
As it were !!!
.
toreador
I like your post. In term of currency trading, there is an army of head&shoulders that need to be confirmed next week too…
Hawaiifive0
Good stuff!