Okay, so that title was a little gay. Sue me, I’m pressed for time, ovah heah.
Cajun asked me to go over the Fibonacci rudiments. Here’s a great overview of the origin of the Fibonacci ratios and why they’re important to traders. Sorry for the “Lazy Man’s Out” with the link, but it’s better you get it from a pro than a rambling explanation from me.
Let’s take it as a given that Fibonacci numbers are “natural ratios” that appear in nature in many different forms, from crystal growth to psychological behavior trends. It is because of the latter that Fib numbers become useful to traders, as even “crowd behavior” — ie, “the Market” tends to follow “the Golden Ratios” to an uncanny degree.
Like any trading tool, these ratios are not perfect, and for my part, I tend to really only use the Golden Ratio itself — 61.8%– and it’s inverse 38.2%, as my primary indicators. 50% percent is also popular, but my own anecdotal experience has found it not as strong as the other two.
I also tend to like using the two year chart to seek out my Fib retracements, choosing the “most likely low to high” (or sometimes, “high to low,” if that’s the case) within that period. I tried to find the broadest spectrum that includes a low that “looks” like a base, as these tend to make for the best retracement observations.
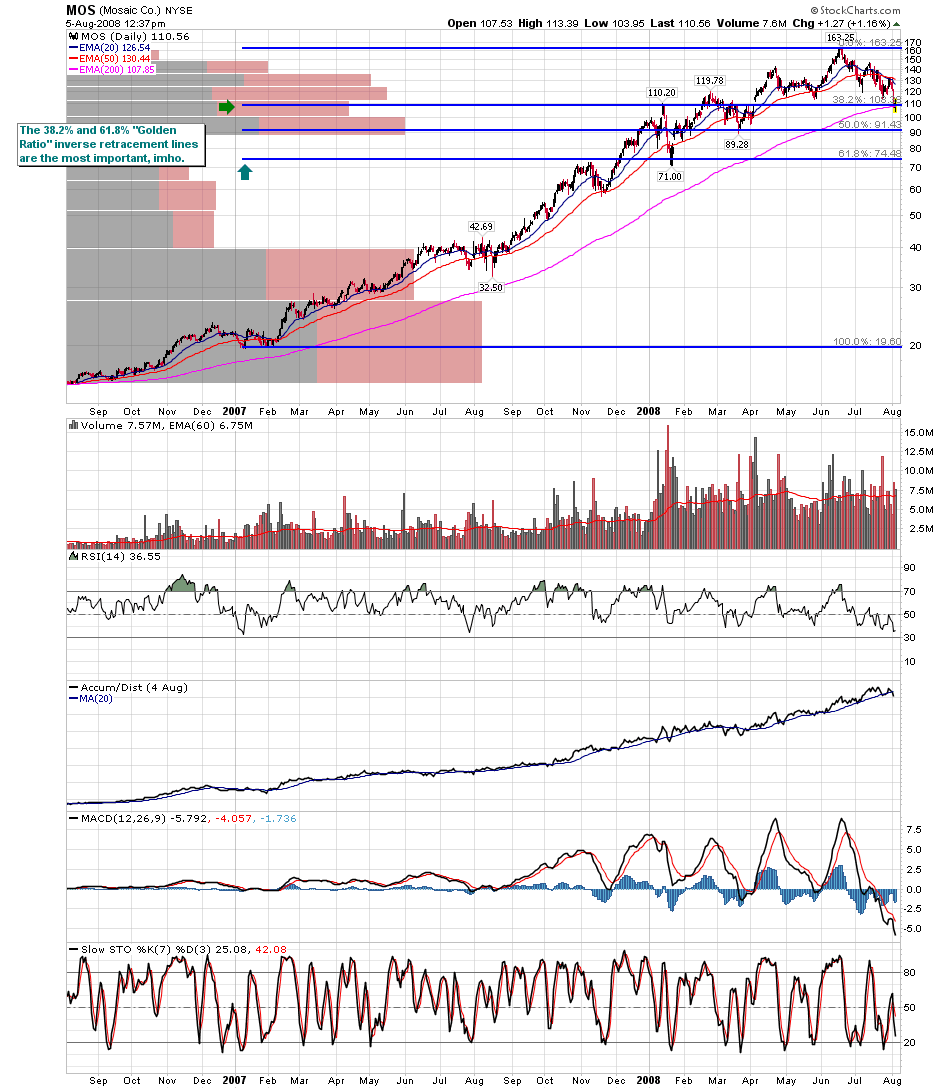
If you note the The Mosaic Company [[MOS]] chart above, I chose the January and February 2007 lows as my base rather than those earlier “spot lows,” as the Jan-Feb line seemed to coincide with a stronger resistance line from my observation. As you can see, there’s some “art” to this, and sometimes you have to play with the charts a little to see if they make sense. Usually, if you’ve chosen the proper starting point, you’ll note how the retracement lines coincide with resistance and support points on your chart.
Note: I am using the Stockcharts.com software to create my Fib chart here for you as it works best with these WordPress downloads. For most of my observations, however, I am using Prophet Charts, which tend to be a bit more exact, visually at least. For example, my Prophet charts gives the MOS 38% retrace at $108.18, as opposed to the Stockcharts at $108.38. This is wholly a function of my using the “eyeball” method on choosing the baseline, and therefore you should always take my Fib calls as “approximates.”
I don’t think this is a big deal, as Fib retracements are “approximates” in any case, and very rarely hit their lines exactly. For this reason, I think they are great “enter and exit” tools, and great for setting stops much in the same way as traditional support and resistance lines are. For what it’s worth, they’ve served me well in the past, and I would recommend that you at least play around with your Fib charting software in both short and long term scenarios.
Ciao, bella.
If you enjoy the content at iBankCoin, please follow us on Twitter

Great Stuff, Thanks!
Jake–
You need to update your photo.
Good post.
[Help me out:…Are you saying that at the magic .618 and .382 things reverse? It seems to me, then, that taken to an extreme, a stock’s price could move, theortically, in such a way as to continually generate smaller, and infinitesimally smaller, “reversals upon reversals” so as to eventually come to a standstill. In effect, the stock would go nowhere, totally confused and frustrated. You get my drift? ]
Good post Jake. Kudos. Bon Mot. The whole deal.
Good info, how did I miss this earlier today? Thanks, Jake.