iBankCoin
Joined Oct 26, 2011
73 Blog Posts

Throwin’ Up W’s

EURUSD showing not one, but two W shaped patterns, indicative of a bottom. It’s not often I’ve seen 2 of these, so i’m sitting just above our 2ed W for a breakout. Bad news is tomorrow is NFP and volatility may lead to this order not getting filled at all.

UPDATE: At 8:20 A.M.  I cancelled this order. Good thing I did.


Comments »

Supply & Demand Trading Revealed Part 2

If you missed Part 1, don’t worry, Part 2 is way better.

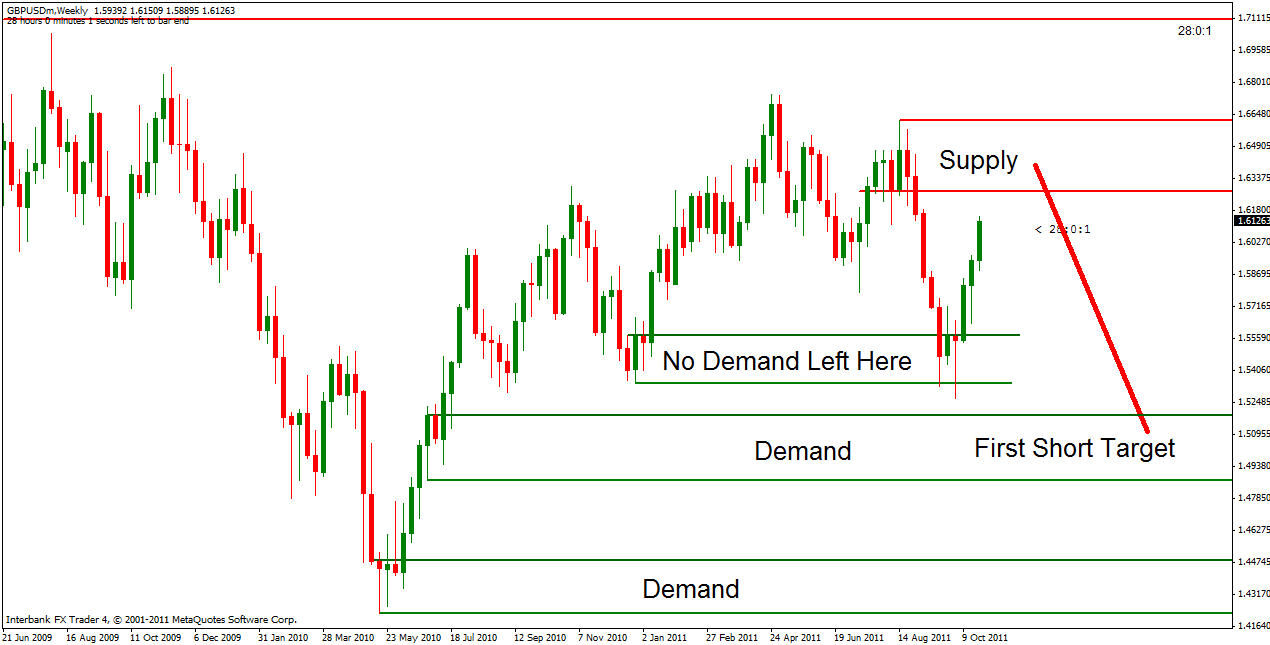
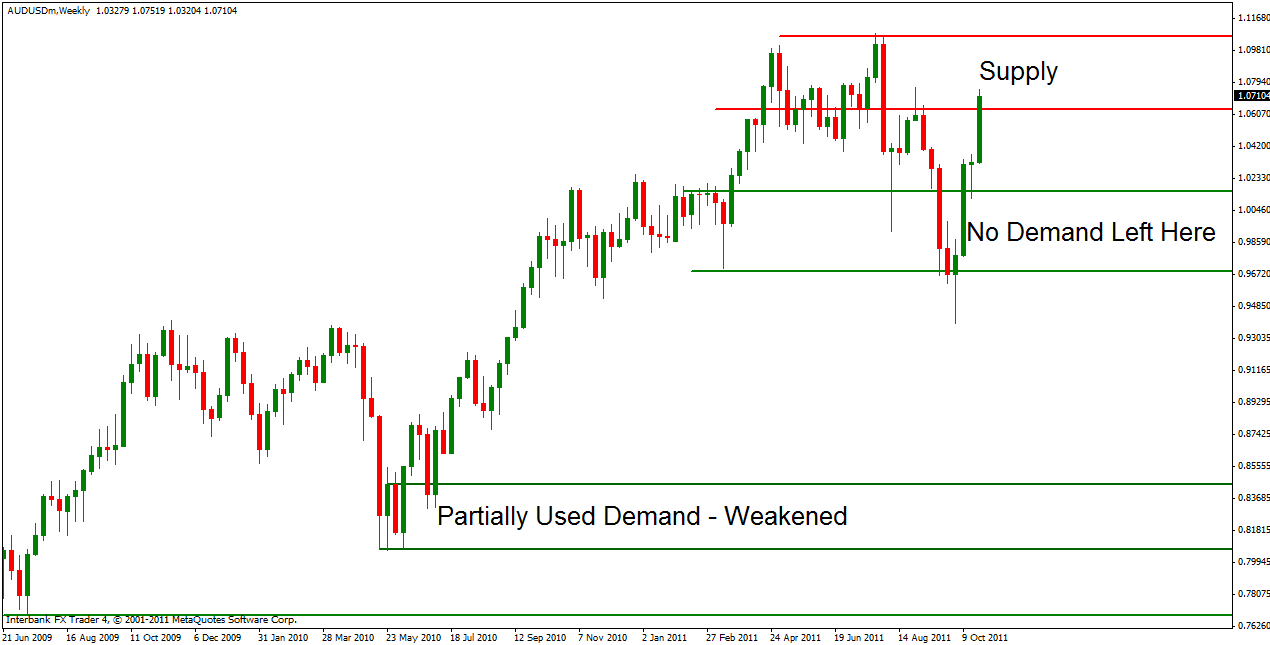
The 4 Types of Supply & Demand Levels

1. Drop Base Rally.

Pretty self explanatory, sort of. Let’s have a look at a DBR.

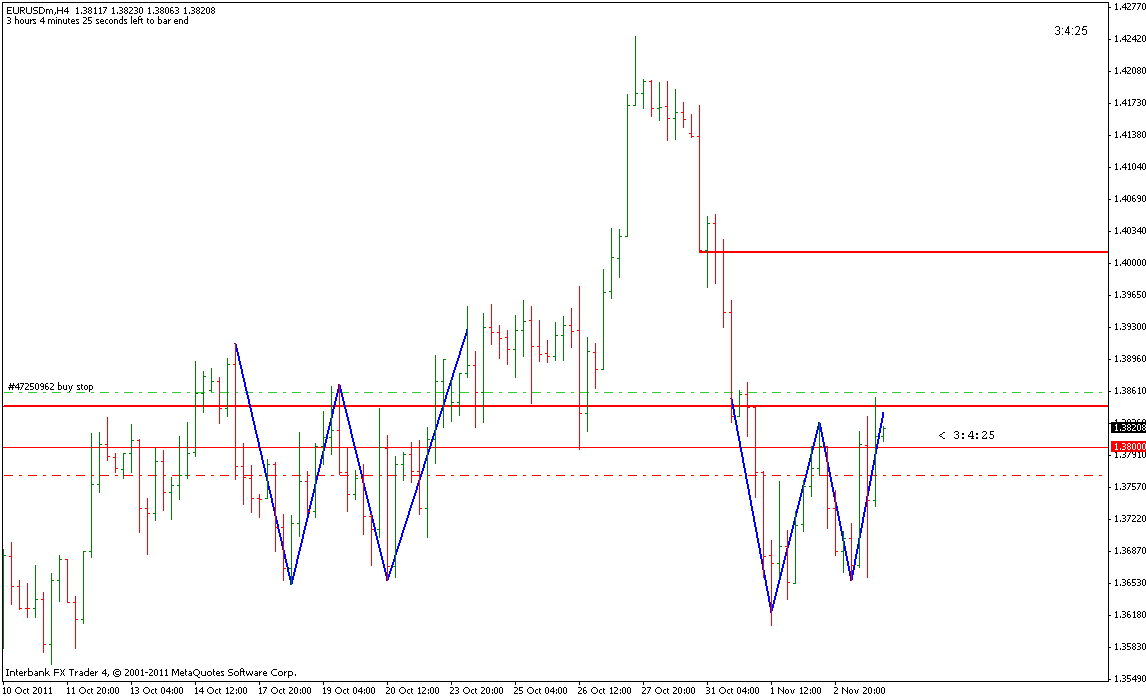
The above chart is a 30 minute chart. If you’re a short term trader this is for you. Mid to long term traders, or those seeking higher probability trades should work off of weekly charts. The premise is exactly the same however. There is one key aspect to finding a quality level, how price moved away from the level. The stronger the surge, bull or bear, the better the level. The rule is, price should move away from a level at least 3 times the amount of the level itself.

In the next chart I use the fib tool as a lazy man’s way to judge a level. The fib levles are 0.0, 100.0, and 400.0. Have a look and then i’ll explain the meaning behind it.

With the Fib tool in place, drawn at the same places as the green lines, you can see that price has risen over 3 times the size of the level itself. Reaching and extending beyond our minimum 3x rule (400.0 fib level). You do not have or need to use the Fib tool to do this, but for a beginner it helps with the visualization. After you get the hang of it, you’ll eyeball it like I do.

In order to do all of this correctly, you need to draw the level correctly. In general, you want to look for price spikes like the examples above, the level itself is an area of consolidation. But, the key part here is candle bodies. Look for 2 or more matching candle bodies and draw your line on those candle bodies. Look again at the example above. The top line of the demand level is drawn right on 2 matching candle bodies. The bottom of the level is simply the lowest point of the swing. I should note that the 2 matching candle body rule is my own rule, adapted to fit the Spot FX market. Any other market and the rules change slightly, but that’s a topic for another time.
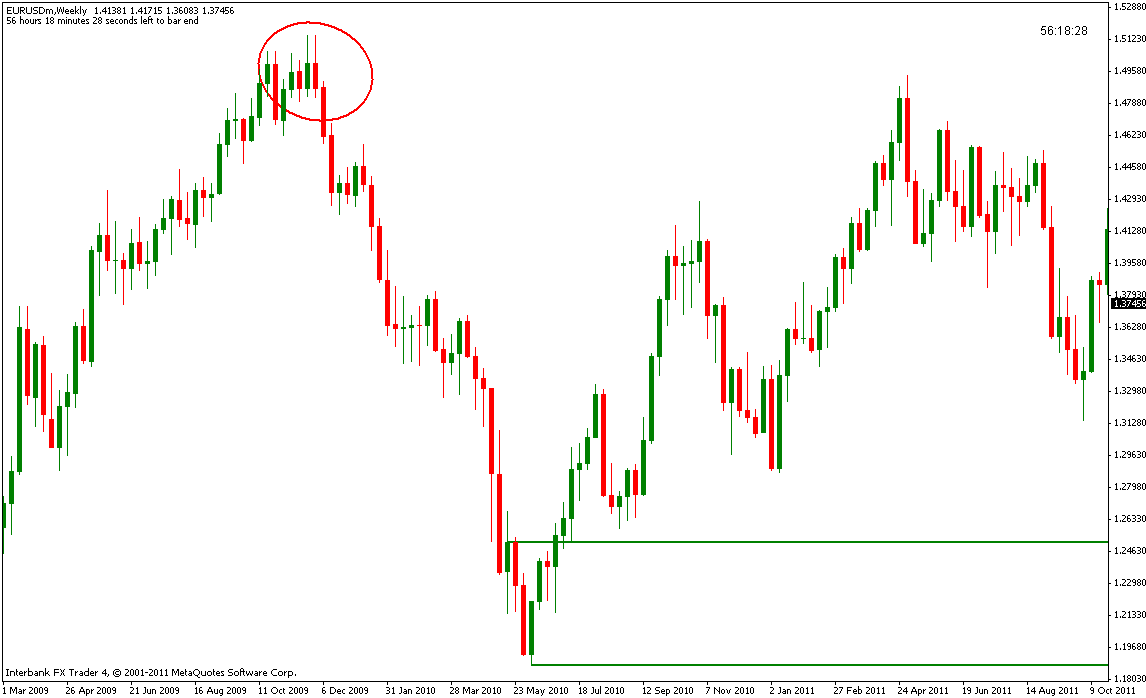
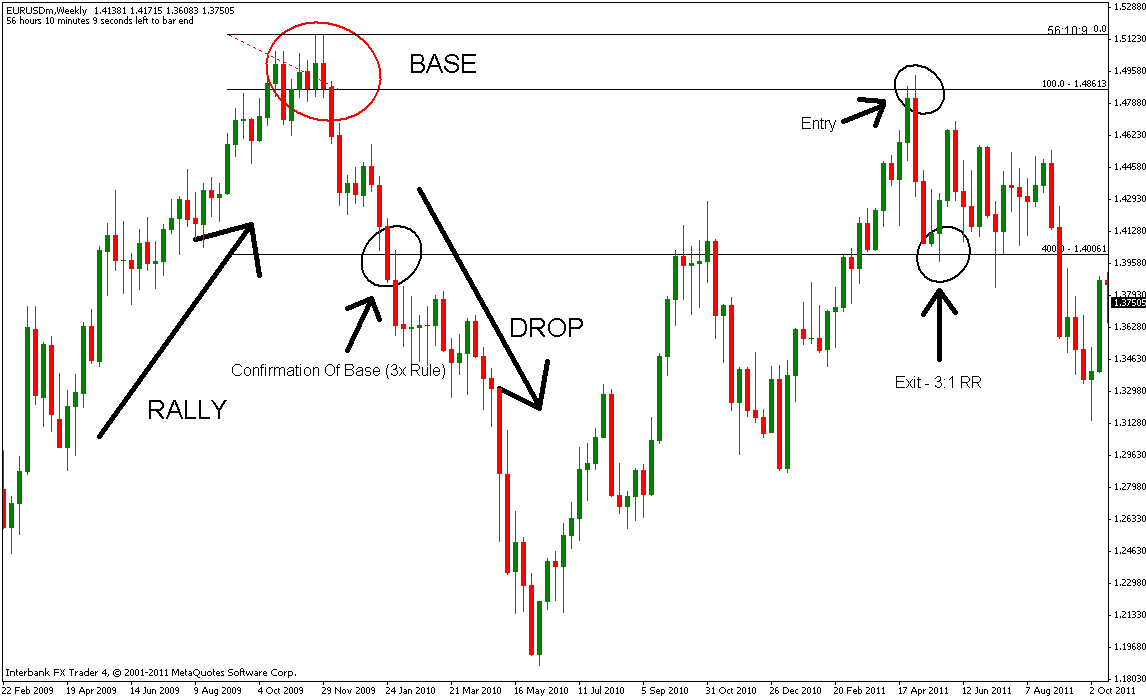
2. Rally Base Drop

A rally base drop is simply the opposite of a drop base rally. Have a look at the base of this rally base drop (circled in red).

Now let’s take a look at our RBD with the Fib tool implemented.

And finally, let’s look at the “traditional” entry point and the exit point. Personally, I have different criteria for entry and exit, but that will be discussed in a later post on the subject.

In part 3, we’ll go over the two remaining patterns…

Comments »

Revisiting AUDUSD

We hit supply and turned down pretty hard. I was so busy being distracted by all this Greek bullshit to even notice. Even finessing a buy of EURUSD for a quick 25 pips. Admittedly AUDUSD still makes me nervous. The profit potential is, well, eh… Not the greatest. Really horrible at this point considering the downfall of the pair. Have a look at the previous AUDUSD chart, then take a look at it today.. It’s looking more like a fucking pinball game than something worth risking money on.

Today


Comments »

Call It Crazy, But I Bought EUR

In order to exact revenge on Great Britain and their stupid Pound, I looked to Italy’s Ariete C1 as my weapon of choice. A single shot from the Ariete C1 allowed me to scoop up 25 pips, softening my GBPUSD 103 pip loss last week. The intelligence leading to the firing of this shot is as such…

USD Index. The oh so reliable Pinocchio Bar.

As we got a USD Index sell signal, we also got a buy signal on EURUSD. Another Pinocchio Bar.

Comments »

Real Time Charts – Free

Easily the best free real time charts out there. NetDania has been around a while and many of you may already know about them. For anyone wanting to follow currencies without signing up for demo accounts and then attempting to keep your demo alive while you follow, NetDania is a good alternative. Not only can you follow currencies, you can follow just about anything traded on planet earth.

Comments »

The Dead Cat Claws Back

Quite an upsurge in the USD Index today, and frankly i’m a bit taken back by the late day continued upsurge. While this may be a dead cat bounce in the making, the cat is not yet dead. Also this bounce comes at the wrong place. Because of that i’m not chasing anything today. Forex or Stocks.

Comments »

Analysis of 6 Major Currency Pairs

EURUSD

I generally work off of weekly charts, but at times the need to find a viable trade requires a lower time frame. That time usually comes when things are more volatile than normal and we get stuck in a range with no real definable long term supply or demand levels coming into sight in the near future. However, considering the USD Index and what’s happening there, the highest supply level shown here may make for a nice trade.


GBPUSD

The GBPUSD is rocket shipping its way into supply. I was long this pair until I did something stupid, erasing half of the gains I had prior to this trip up in my trading. Yes, I am still beating myself up over this. The perfectionist in me demands that I do so. Provided we get some nice price action, I will short this pair when we arrive at supply.


USDJPY

There’s absolutely nothing I like about this pair, therefore it earns the “Calvin Award”.


USDCHF

This one has some potential, while it’s a rather large demand zone, if price action gives the go ahead i’ll go long here.


AUDUSD

This one is tricky. Demand has sent us straight back into supply twice now. Short term short positions if they look good. I’d be hesitant to hold anything long term.


USDCAD

Another Calvin Award winner. Absolutely nothing I like about this pair.

Comments »

Bulls May Be In For An Unwelcome Surprise Next Week

Looking at the USD index, we are rapidly approaching a level of demand. As long as we don’t see consolidation start to set in just above this demand, the odd’s of a reversal are fairly high if we plunge right into it.

Weekly Chart

Daily Chart With Weekly Levels Shown

UPDATE

Should this level fail we also have another potential reversal point just below it. Often times a level will be broken through unexpectedly and still hold. This is one of those potential cases.


UPDATE 2

Another case for the Bear. Dow futures appear to be a run away freight train into the above supply level.


Comments »

Supply & Demand Trading Revealed Part 1

Maybe you’ve watched the webinars mentioned in this blog post, maybe you haven’t. The good news is you don’t have to. I’m going to lay it out for you in a relatively easy way to understand as it relates to trading the Spot Foreign Exchange Market.  I prefer to get straight to the point. A lot of the jibber jabber about politics, economics, and opinions about how much the EU blows circus clowns while swinging on a trapeze fitted above a pit full of hungry alligators,  or is using magic money , will all be left out of this.

We will use price and nothing more. Fuck your moving averages, RSI, Stochastic’s, and any other voodoo indicator created as far back as the fucking Egyptians. There are in fact people out there that use these indicators against you because they make you predictable and vulnerable. They already know what it is you will be doing and when you will do it. I know some of them, and they take advantage of you on a scale Bonnie and Clyde would envy.

Everything I present in this series of posts can be carried over into any market you wish to apply it to. I personally use it within FX and Stocks. However you can use it in bonds, deciding to buy put or call options, futures, you name it. The concept applies to all of it.

What is trading supply and demand?

– It is about as high probability as you can get, when you apply it in a certain way. You CAN fuck this up, but i’ll try to show you how not to, like I did recently.

– It can be used for anything from scalping to short and mid-term trading, and even long term investing.

– It is surprisingly very easy if you do not over think/analyze it.

What trading supply and demand is not?

– It is not the holy grail. Supply and demand changes just as much as the market itself does. Price, at all times, is a product of the ever changing supply and demand of a stock, currency, or anything you can think of.

In part deux I will go into the 4 types of  levels and identifying and qualifying a supply and demand level. Have a good weekend!

Comments »