The benchmark S&P 500 index opened last Monday at 1832, grinding sideways for much of the week, ultimately with a slightly bullish bias to close the week out at 1842.
For the week, the S&P rose 0.54%.
Underneath the surface, Treasuries and commercial real estate stocks led, while the mega caps in the Dow and semiconductors lagged.
B. STRATEGY FOR PLAYING THE LATEST NEWS HEADLINES, EARNINGS SEASON, AND MACROECONOMIC DATA; SPECIFICALLY TUESDAY’S RETAIL SALES, WEDNESDAY’S PRODUCER PRICE INDEX, THURSDAY’S CONSUMER PRICE INDEX, JOBLESS CLAIMS, AND PHILADELPHIA FED SURVEY, AND FRIDAY’S HOUSING STARTS AND INDUSTRIAL PRODUCTION.
[Please click here to see the full earnings slate of which firms report and when. Please also click here to see the full economic calendar for the week ahead (you might need to click ahead to Monday, January 13th)]
Heading towards a new earnings season, keep in mind there are plenty of different styles that can be profitable in the market as a trader. My discipline is to usually not hold trades through earnings reports. If you do want to hold a position through the firm’s earnings report, I would suggest that you consider lightening up the position a bit before the announcement in order to mitigate the known unknowns/risks you are assuming.
Either way, I urge you to check and then double-check your current portfolio holdings to see when the firms you own are scheduled to announce earnings. As a swing trader, I am almost always looking to significantly reduce or outright close a position into earnings. There are simply too many external variables, particular to the firm in question, from an earnings report for me to have an edge. As an example, even if you do possess some type of insider or unique information about a given firm’s impending earnings report, there is still no way to know how the market will react. Stocks can just as easily sell-off on great earnings as they can on horrific ones, and vice-versa.With that in mind, I want to point out one crucial difference between specific earnings reports relevant to the stocks of firms you own versus politics, a broad economic report, and monetary policy decisions. In trending markets, up or down, the macroeconomic data (not microeconomic, such as earnings reports) tend to be interpreted by the market in favor of the prevailing trend, even if the numbers wildly miss or easily crush expectations.
In sum, macro reports should not be treated as the sole reason to exit a stock, whereas a specific firm that you own reporting earnings most certainly can. Moreover, the reaction to the initial reaction in terms of the price action by the market after a given data point or earnings report is what matters most to swing traders.
Technical analysis has its clear limitations in that it can usually only analyze that which is currently known and legally knowable by the markets. To presume that charts can dictate everything into the future is pure folly. Trading, for all intents and purposes, is gambling, as we are wagering on outcomes yet to be determined. Instead of running away from that fact, a better approach is to embrace sound risk management principles and become astutespeculators.
II. THE WEEK AHEAD
A. CURRENT MARKET POSTURE
1. Kicking Off the Year with a Grind
Regarding the structure and overall setup of the major averages, the S&P 500, Nasdaq Composite, and Russell 2000 indices have all been grinding sideways since New Year’s Eve.
All three indices had become quite stretched away from their respective 200-day moving averages, increasing the possibility of some type of correction or pause. For now, the action has been more of the pause variety rather than that of a deep pullback, or anything close to it.
A few weekends ago, I noted about the S&P:
…how extended price currently is away from its 200-day moving average. After such a steep uptrend (dating back several quarters if not years), this circumstance likely lends itself to a mean reversion with price coming down, even if a precise test of the 200-day does not materialize. As a result, and due to the narrow pockets of momentum we saw in the market last week, I am going to suggest using further strength in the coming week to reduce long exposure and then reassess the broad market after the new year kicks into full swing…
Given the uninspiring price action in some marquee names, such as AAPL NFLX TSLA TWTR of late, I still believe it to be the case of a narrow market, even with the highly speculative action in quite a few biotechnology stocks last week. Specifically, regarding the fast and hot momentum in some of the high beta China and biotechnology stocks, when combined with extended major averages and lackluster performances by liquid marquee names, listed above, it can be viewed as a sign of froth for a market about to correct (recall the COST SBUX examples last week of extended stocks correcting down to or near the 200-day moving average).
In other words, stay selective and opportunistic for inter-market trades, discussed later this weekend.


2. Tight Long Ideas for the Week Ahead
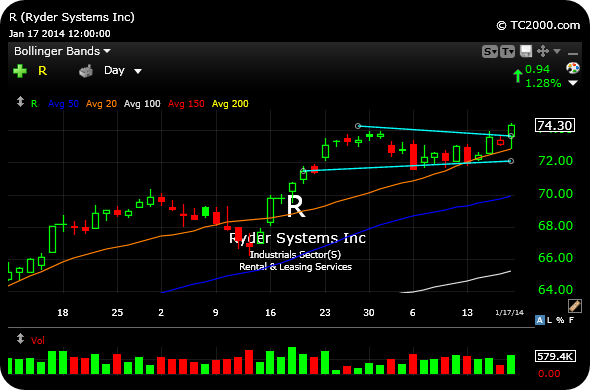
I see ALNY BPFH COWN CTCT DMND LOCK QLTY as being actionable long ideas with strength out of the tight daily chart consolidations, in uptrends, highlighted below.


3. Update on Several Commodity ETF’s
Coffee is performing well, holding above the ETN (JO)‘s key $23 level. A move over $24 now likely represents a chance to add to a long position, playing for a further snapback rally after a fierce, multi-year downtrend. I am cautious if price falls back under $23.

Corn has been slippery, in terms of trying to time a bottom for another multi-year soft commodity downtrend. However, Friday’s action was encouraging, with a massive bullish engulfing candle on heavy buy volume.
After a steep downtrend, the bullish engulfing candle (where the price action of a given session literally “engulfs” the prior day’s, taking out the lows and closing above the highs). Holding above $31 and especially $30 is going to be key now to form some type of tradable rally.

And natural gas closed the week out right at the prior $19.80 breakout level. It has been an aggressively pullback off the recent high volume breakout.
If bulls can defend this level in the coming week, another long natural gas trade might finally be had. However, that $19.80 level simply must hold for the trade to have a chance.

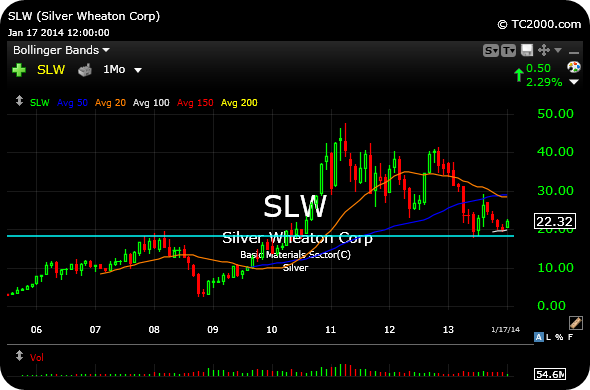
4. Oh, Those Sneaky Miners
After offering select long and short trades for opportunistic, disciplined traders in the summer and fall 2013, the precious metals and miners have been decidedly not tradable of late, with fits and starts in either direction.
From a broad perspective, though, the last push lower in price saw the early-June 2013 lows breached. However, that price low came with bullish RSI divergences still intact, meaning that downside momentum clearly was not as favorable to bears as it once had been in a strong bear market.
For reference, the RSI is simply the “Relative Strength Index” used to identify changes in technical momentum. Above 50 is generally considered a bullish RSI, with above 70 viewed as overbought. Trending below 50 is considered a bearish RSI pattern, with below 30 considered oversold. I have indicated this RSI divergence on the weekly chart for the miners.

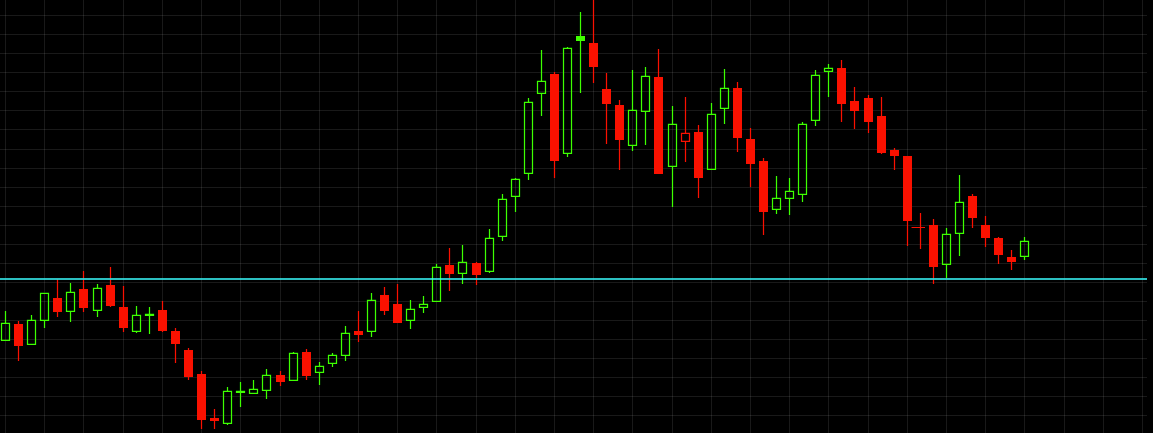
And turning to the daily timeframe for the gold miner ETF, should bulls be able to crack $22.20 to the upside in the coming week, it would put into play a multi-week bottoming pattern (light blue lines), targeting about $24.20.

5. General Trading Concepts to Keep in Mind
It is important to remember that the stock market is the final arbiter. Regardless of our beliefs on political, fiscal, or monetary issues (oftentimes, all three can be combined), the opinion of the market is what matters most for technically-driven swing traders. There are many different ways to consistently profit in the market over time. The key, though, is not commingling styles for the sake of convenience or to try to substitute one style for another in lieu of discipline. A classic case would be making a bad trade, then deciding not to cut your losses and instead turning the bad trade into a long-term investment out of convenience.
Finally, it is crucial to be aware that at least eight out of ten stocks tend to move with the market, and most breakout plays fail in corrective markets. Thus, you simply must be aware of the overall market, regardless of how enticing any individual chart looks. If the market continues to improve, so too will breakout plays, almost by definition. If breakout plays break the hearts of eager hot money traders, that is a sign to exercise caution.
B. LEVELS TO WATCH
- On the S&P 500 Index: On the upside, watch 1843, then 1849. Downside levels of note are: 1823, 1813, 1800, 1772, then 1746.
- On the Nasdaq Composite Index: On the upside, watch 4,175, then 4,182. Downside levels of note are: 4,111, 4,068, 4,040, then 4,022.
- On the Russell 2000 Index: To the upside, watch, 1,165. On the downside, watch: 1,137 1,136, 1,124, then 1,096.
III. LONG TRADING IDEAS
I like the following long ideas only on further strength this week. I recommend that you keep protective stop-losses on all trades, not much looser than 7-8% from where you initially buy. Also, please be sure to check earnings dates for any and all of your holdings.
- ALGN
- ALNY
- BPFH
- COWN
- CTCT
- DMND
- GNTX
- LOCK
- QLTY
- YONG
IV. SHORT TRADING IDEAS
Here are some ideas with vulnerable charts that I would consider swing trading on the SHORT side ONLY ON WEAKNESS in a broad market which accelerates to the downside. Short-selling includes unlimited risk, since stocks can rise indefinitely, or at least much longer and much higher than seems reasonable. Thus, I strongly encourage you to define your risk beforehand via a concrete buy-cover protective stop-loss, in the event the trade goes against you. Also, please be sure to check earnings dates for any and all of your holdings.
- COP
- DNKN
- GM
- MCD
- MRO
- MUR
- NKE
- SBUX
- TGT
- VZ
V. QUOTE OF THE WEEK
“What is success? I think it is a mixture of having a flair for the thing that you are doing; knowing that it is not enough, that you have got to have hard work and a certain sense of purpose.” -Margaret Thatcher
Trade well, and protect your portfolio at all times.