iBankCoin
Home / 2014 (page 329)

Yearly Archives: 2014

The Fix is In

BfNMtPdIUAACeDB.jpg-large

You can argue all you want about how Starbucks has long-term coffee prices locked in, or any other fancy notions of how the CEO’s business acumen somehow makes the stock immune to steep corrections.

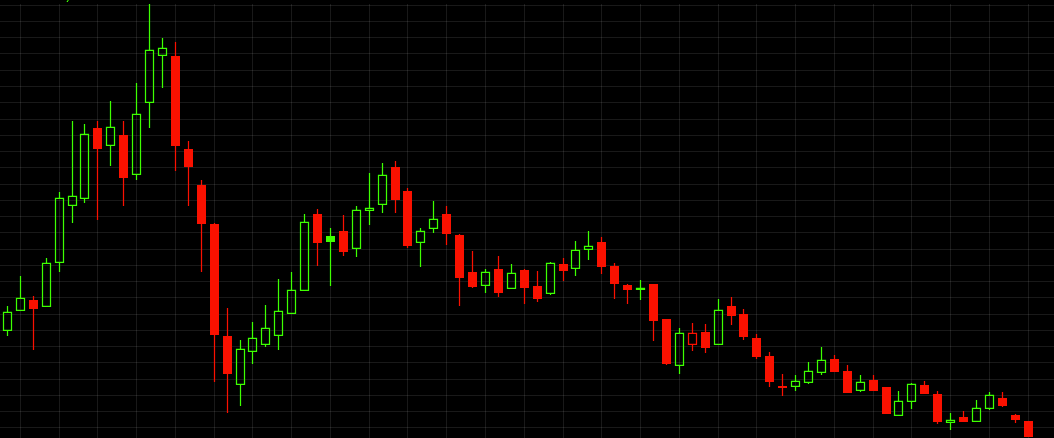
But the truth of the matter is that SBUX Is almost assuredly getting hit with both sympathy selling due to the strength in the coffee commodity (no one said the market had to make sense–It is an emotional beast, oftentimes), as well as the rubber band snapping back for the crowded consumer stock itself in recent quarters. If you follow my work, then you know I have discussed these concepts many times in recent months.

Overall, the broad market remains in correction-mode, which means you can sidestep big drawdowns by keeping cash levels high in your portfolio and picking off opportunistic, inter-market trades we are stalking inside the 12631 Trading Service this morning.

As I noted over the weekend in my Strategy Session, even though stocks like F GM may have been too steep to safely short early this week, they are still dropping lower yet. Similar comments apply to Russia–RSX. Thus, for now, I am resisting the urge to bottom-pick.

Comments »

One Pair or Two Pair?

Jennifer_Tilly_and_Phil_Laak

Any way you slice it, here is a pair trade to consider in the transportation sector—Long ARII, Short FDX.

ARII is a small railcar play still in an uptrend, basing sideways. I like it long only on strength over Friday’s highs.

FedEx broke from its steep rising channel and I like it short below its bear flag.

Which tickers are at the top of your watchlist this morning?

_________________________________________________________

ARII

_________________________________________________________

FDX

Comments »

Reconciling the Good with the Bad, Part II.

The following is just a small excerpt from my latest Weekly Strategy Session (please click on that hyperlink for details about trying it out). which I published for members and 12631 subscribers this past Sunday. 

Despite the potential bright spots for bulls, on top of headline-grabbing earnings pops fromCMG GOOG last week, the “sneak preview of coming attractions” thesis I advanced in a January 5th, 2014 Strategy Session has been playing out nicely for bears.

As I wrote back then:

A new wrinkle which I would like to add…is a sneak preview of what we may see from the S&P (500 Index) and Russell (2000 Index).

Both Costco and Starbucks are two all-American firms and stocks. They enjoyed steep, virtually uninterrupted uptrends throughout 2013.

Recently, though, both have struggled and appear to be bear-flagging for a deeper pullback yet. This circumstance need not mean that both stocks have topped out on a multi-year basis, or anything close to it.

However, you can see what happened when price became too extended from the 200-day moving average after a fierce, multi-quarter uptrend.

Updating not just COST SBUX, but also the consumer-sensitive Ford, you can see all three charts are now below their respective 200-day moving averages. While I would argue all three are almost assuredly too steeply oversold in the short-term to consider shorting with fresh capital early this week, the take-home message is that the major averages could easily follow these important stocks lower–Recall how many bulls last fall were scoffing at the notion stocks like Costco or Starbucks, even Ford, could swiftly correct down below their 200-day moving averages. 

For reference, consider the Nasdaq and Russell daily charts, and how extended they had become from their respective 200-day moving average with no test in over one full year. Not unlike COST F SBUX, the rubber band snapping back can happen quickly and undershoot to the downside in the same manner the overshot to the upside occurred.

In addition…

Please click here to for Part I. and to continue reading the rest of this weekend’s Strategy Session

Comments »

Late Night Setups for Monday

seattle-night-skyline-tanya-harrison

CSOD is still a long idea, should we see a broad market bounce which sticks. I like the stock back over $57.20 from the sideways basing action within the context of an uptrend, first daily chart below. This is a good young tech firm.

EBAY is still in a multi-quarter potential topping-out process, after a prior steep uptrend, seen on the second chart below. Whichever way this breaks is sure to be an explosive move, in my view. I suspect risk is still to the downside, and would consider a short here under $53 and especially below $52.

Drop me your top tickers overnight.

__________________________________________________________________

CSOD

__________________________________________________________________

EBAY

Comments »

And the Winner Is…

finish-strong

Congratulations to reader “illmighty” for winning a photo finish against two-time champ, “BurgDeBerg,” in correctly guessing the mystery chart from my last post.

As illmighty noted, the chart is the monthly timeframe of Petrobras, the Brazilian energy giant.

But BurgDeBerg gave some great commentary in his narrow defeat.

Here is what Burg had to say:

It’s a $PBR monthly chart in the oil & gas/energy sector. Looks terrible really, but also perhaps oversold and over-hated. Could be strong with investment ramping up in Brazil going into the 2016 Olympics.

What do you think?

Earnings are scheduled for February 14th.

The monthly chart is clearly bearish. But, as Burg notes, perhaps it is so bad that it is good? I would prefer to see more of a washout and perhaps crash in order to look to buy the blood, though.

Also, can Peyton Manning and the Broncos make adjustments and come back in the second half?

Thank you to everyone who played.

I will be back later with ideas for Monday.

But I already gave tight analysis in my latest Weekly Strategy Session published, earlier today. Check it out!

Enjoy the rest of the Super Bowl.

______________________________________________________________

PBR


Comments »

Name That Chart

291758-sopranos10805

Hint this week: The chart dates back to 2007.

Try to guess:

  1. The ticker symbol of the chart;
  2. The sector in which the stock trades; and
  3. Whether or not you think the stock and sector will move higher or lower throughout 2014.

Thank you to everyone who has been playing along.

Please click on chart to enlarge

[Members: My latest Weekly Strategy Session has been published]

________________________________________________________________

2014-02-02_1437


Comments »