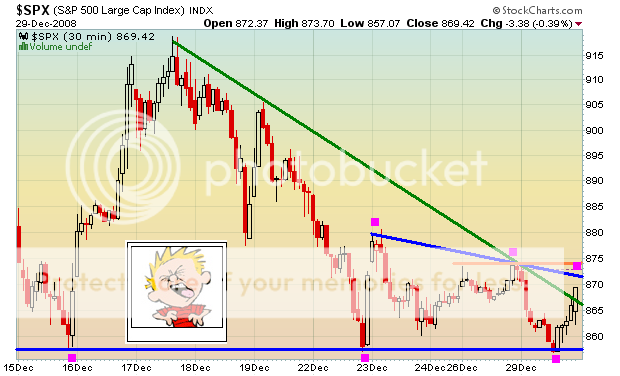
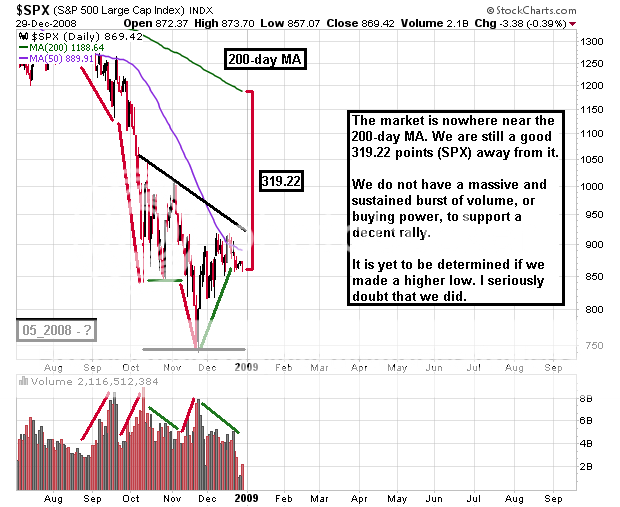
We are still in the range that is bound by 1) the 20-day MA @877, 2) the 30-day MA @863, 3) 855 support which doesn’t seem to be cracking, and 4) the LH trend line ending at 870 (sky blue 35-day chart). All of these areas are boxing in the market within a tight and narrow range, a ‘pattern’ that hasn’t been seen in months. However, this doesn’t mean that there won’t be any more volatility.
Today’s action showed the strength of the 855 support level. At this point, the 50-day MA is now at the half-way point between 855 and 920. We’ll have to break out of #1, #2, and #4 (above). Can any of this action be trusted? No. The holiday volume is so light that anyone with big money can actually bully around stocks all day long. We will get full participation only after New Year’s.
It seems like only safe way to determine a breakout or breakdown is to wait until 3:57PM when you know for a fact that the market will close up or down +/- X, and then place your orders. What happened in the last few minutes yesterday showed that the “WTF” still lives and isn’t going anywhere anytime soon. I am personally betting more toward the short side as of today).
Looking at the long-term, we could be in the eye of a Category 5 hurricane. The light winds and clear skies don’t seem to bother people much because most people got the shit kicked out of them when the hurricane approached early this year. Looking at the previous reference point of the 2001-2002 crash, we may be in the eye for several months a.k.a. “dead money” for long-term investors. What will be true is that 2009 will once again be a year full of trading, instead of buying and holding. All we can do is make assumptions based on the past, unless you have a time machine.
For now, we just have to get out of this range. I wonder what the catalyst will be…
SPX 1-day
SPX 3-day
SPX 5-day
SPX 10-day
SPX 35-day
SPX 4-month
OK, first, let me say that the market may NOT match 2002’s bottoming process. Who knows what will happen. Just use this as a reference, not some kind of “sure thing”.
2002-2003
2008-?
If you enjoy the content at iBankCoin, please follow us on Twitter


thanks
Good post. The 35 day chart downward trendline is right where we are meeting resistance today. I think that descending triangle now gains added significance from today’s action.
going bullish CA?
G – you’re welcome.
I&S – There needs to be a successful test of the 50-day MA on the 35-day chart. That will provide a springboard to break 920, but shit, anything can happen.
jig – I’m in cash until after Jan 1. I don’t know if the market will reach 920. We’ve been churning on/around the 50-day for weeks now, but on lower and lower volume. I’d like to see full market participation instead of this bs end-of-day crap.
Still a day traders market. sigh
WTF?
Was my post removed?
_____
Which post Jake? I would never remove your posts. I checked the spam folder, and no post 🙁
I don’t think it was you, kid, I think it might have been “the Administration.”
Either that or I had a brain fart regarding pressing “submit comment.”
I had made a joke about your character use today. The author is known for coming after people who steal his “children,” as he calls them.
__________
The big Pic…any Candlestick Traders?
http://tinypic.com/3ia05w1c