Well, pretty clear the Volatility Explosion of 2008 has hit all asset classes. But not in the same way.
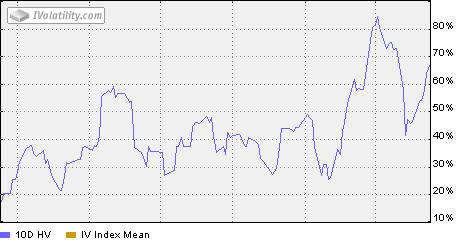
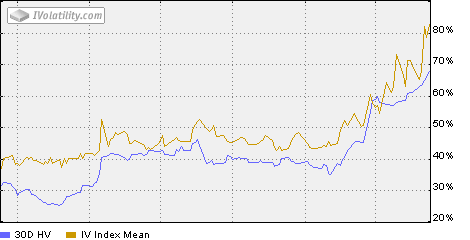
The graph’s here show USO 30 Day numbers up top, and 10 Day HV down below. And notice something different from, say, the indices?
Anyone? Anyone? Buehler?
OK, here’s the answer.
USO options volatility, the yellow line in the upper chart has spiked to a similar absolute level as SPY and QQQQ and IWM volatility. But volatility of USO itself has actually remained below options volatility. Even the “noisier” 10 day reading has peaked at levels roughly equal to the 30 day normalized options volatility.
I will go back to the same point as always; options prices depend on context. As high as regular stock options got, they never got to the levels of realized volatility in the marketplace. That does NOT mean they are a buy per se now, just that they have been a buy to this point of the move. USO however has the opposite behavior as options overpriced (to this point) the move.
Again, that does NOT necessarily 
 mean they are a sale right here and now, just that they HAVE been a theoretical sale at times.
So, going to take my chances here as I found a spot I actually like shorting puts as the way to get long.
If you enjoy the content at iBankCoin, please follow us on Twitter


yes my friend… long oil!
love getting your endorsement on it!
Adam, need some help please. How would you set up a collar trade on 3000 shares of QCOM going into 2009? Cost basis is under $2.00.
thx