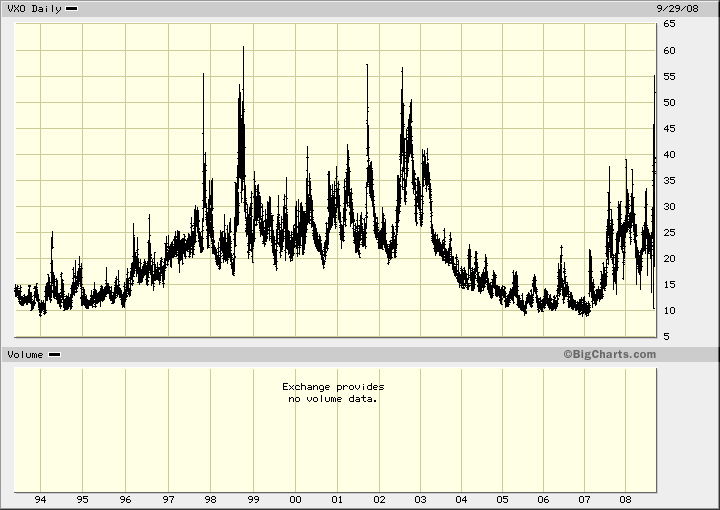
OK, quick primer on the VIX.
The VIX you see on the board is a measure that has existed only since 2004. So thus when you hear it hit a “record”, it’s not as impressive as meets the high. And it was indeed a record yesterday. Bill lists the prior Top Ten closes here.
Long story short, the VIX officially began in 1993. It estimated volatility by creating a “normalized” 30 day hypothetical ATM option based on some near-money options in the OEX. In 2004, the CBOE created a “new” VIX, that substituted SPX for OEX, and included more strikes. The “old” VIX changed it’s symbol to VXO. The chart above shows VXO since it’s creation, and as you can see, it spiked into the 60’s a couple times.
But wait, that’s not the whole story either.
You can still calculate what the VIX or VXO would have been prior to 1993 by just using their methodology on old quotes. And I’m not sure if there’s an official number for the peak in the 1987 crash, but I’ve seen numbers from 150 to as high as 172 for what’s now the VXO.
So just note that truly anything can happen. Among the sillier observations I have seen is the notion that the “cash” VIX is some arbitrary amount above the VIX futures. That number set records too (VIX futures are relatively new) and kept going.
Basically, take it as a given that we are wildly over-panicked by options measures. It will resolve at some point and in hindsight we’ll have a New Rule that will ultimately prove as meaningless as the last batch of rules. This will resolve at some point in a massive rally, just tough to say when. 


Thanks Adam 🙂
Adam,
I don’t have time to go into it, but there are studies out there that look at “realized” volatility in the stock market, vs. the VIX, which as we all know is “implied” volatility, based on the options market.
http://www.ssc.upenn.edu/~fdiebold/papers/paper43/abdl4.pdf
While the VIX is hitting highs, the data only goes back to 1993, like you indicated. This limits us from doing a big picture look at actual volatility over several bull-bear market cycles.
A friend has run the numbers and indicated to me that realized volatility, from a long term historical perspective has only reverted back to it’s 100+ year mean.
For those that are thinking about it, doing a “Costanza” here and “shorting” volatility might be a little early, given the magnitude of the current crisis.
Increased volatility from here would not be out of the norm, from a historical perspective.
Cubs Rock: Thanks.
Alpha: Interesting. And yes, that’s almost exactly the point. It’s generaly right actually to buy options when this happens, although with the extreme caveat that you want them ATM or ITM and nearer month.
Adam and Alpha,
Thanks for the information and the insight. I’ve been around a while and it seems with all of the “instant information” now available at our fingertips, there is less quality and very little analysis. The point about being able to get “Big Picture” perspective is fundamentally important, since it will separate the traders/investors who get out of markets like this alive (or maybe profit), and those that go home broken.
tanks.
I think my biggest problem with the “analysis” is that it conveniently forgets any false signals that JUST HAPPENED. I mean in the last 2 weeks, the VIX has broken 30, 35, the yearly highs, the yearly closing highs, 40, and now 45. So far, all but the last one gave a bad signal. And the last one is all of one day old, so too early to tell.
Just goes to show that you cannot rely on just 1 technical indicator.
According to Yahoo! Finance VXO chart (I guess the CBOE went back and calculated the data), the intra-day peak was 171.52. Taking the usual 5% difference between VXO & VIX into account, the corresponding VIX number would be 163.35. We’re not even halfway there!
yup. Not saying that’s going to happen again, or that we haven’t bottomed, or whatever. But there’s panic and there’s PANIC.