The previous article, Long Term Investors Crazy Not to Sell in May?, we examined a basic Sell in May and Go Away strategy. This update will add an additional factor to the strategy, which is to use the 200 day simple moving average to keep the strategy out of the S&P when it is in bear market territory.
The Rules:
- Long $SPY from the close of the last trading day of October through the last trading day of April IF $SPY is above its 200 day simple moving average.
- Long VBLTX (Vanguard Long Term Bond Index Fund) from the last trading day of April to the last trading day of October.
- First day of test is 6.20.1996. Last day is 3.28.2013. First day is first day of history for VBLTX.
- No commissions or slippage included.
Note: I spent some time trying to find data for a bond index which would allow me to go back farther than 1996. I did not have any luck. If anyone knows of a suitable government bond / credit index (or mutual fund tracking such an index) with accessible data going back farther than 1996, please let me know.
The Results:

The top pane is $SPY. The middle pane is the equity curve for the strategy. The lower pane shows the drawdowns in percentage terms. The blue portions of the equity curve represents time in $SPY while the green represents time in VBLTX. Compared to the basic strategy, adding the 200 day moving average requirement keeps the system in VBLTX for significant amounts of time.
Statistics:
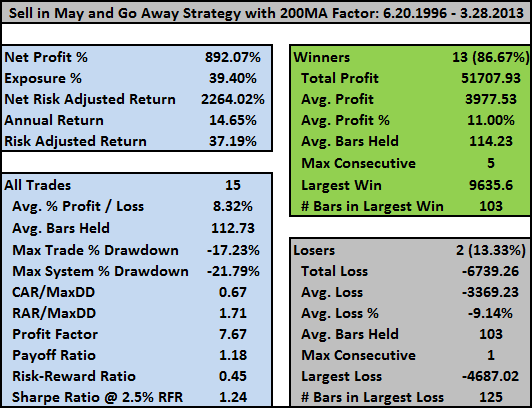
Because of the way I coded his, all the trade information pertains only to the $SPY trades. The returns from VBLTX are built into the overall returns but are not considered to be trades.
If I subtract out the added return from VBLTX, the annualized return from just holding $SPY is 10.69%.
$SPY buy and hold over the same period is 5.26% with a maximum drawdown of -56.47%. So even if you do not rotate into a vehicle to provide a return on your cash, you still double buy and hold just by selling in May.
Historical Profit Table:
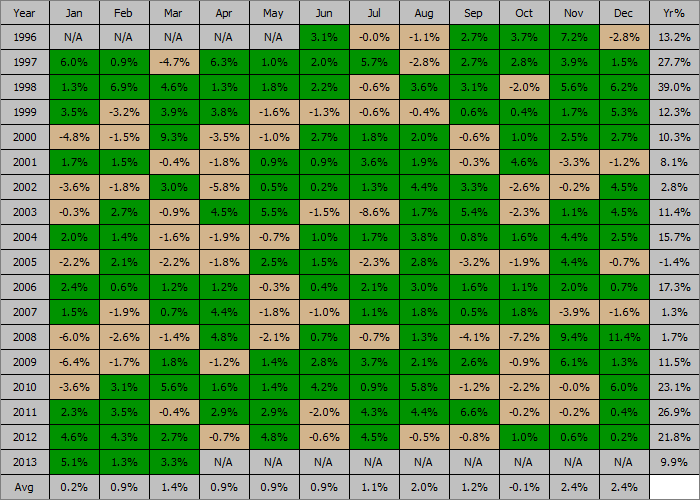
The strategy has performed unbelievably well, any way you slice it.
However, I have my doubts going forward. They are best encapsulated in a comment left by Kill The Banks, in the previous post:
I think there needs to be some evaluation of bonds as an appreciating asset class going forward. There was some blogoland chatter a few months ago regarding the “max theoretical gain” left in bonds (forget if it was the 10yr or the 30yr) and that number being around 17% total net or so (IIRC). Sentiment seems to be that given the current interest rate situation the only direction rates can really go is up, which translates into “bonds down”.
Me, I’d be wary of the forward usefulness of any methodology incorporating bond longs that has good backtest results.
With that comment in mind, what would we rotate into, if not for bonds? Is there another asset class that should be considered during the May – October seasonal period?


I’m dong a similar seasonal strategy with a portion of my 401k. With the limited options available to me, I’ve been considering allocating this portion to a Stable Interest Fund during May-Oct. Not as good as historical bond total returns, but better than cash. The fund (and similar) are supposed to be protected against interest rate volatility.
Is there a particular stable interest fund that you use or prefer?
There is no associated ticker that I can find – “The Stable Interest Income Fund is 100% invested in the Northern Trust Stable Asset Fund (the Underlying Fund). The Underlying Fund is a portfolio of contracts purchased from leading life insurance companies who manage well-diversified portfolios with low exposure to below-investment grade bonds.”
Just thought others might have a similar option in their 401k but otherwise don’t know how one would perfectly replicate it – probably not too different from several short-term bond funds.
1 yr returns: 2.84%
3 yr returns: 3.41%
5 yr returns: 3.78%
10 yr returns: 4.86%
Also, within the seasonality strategy, I’ve backtested some very acceptable results using weekly/monthly moving average crossovers – basic, but seemed to outperform using the 200DMA on the daily.
Ive been coding a similar strategy utilizing away in may…. why dont you consider moving 1/2 to cash and the other 1/2 to low beta, low volatile, utility like dividend payers in May (SPLV etc or a utility etf).. Wood, program this in using the SPLV and SPHB (long SPLV in May to Oct — long SPHB Nov to April).. short history but good results
Hah, I’ve been messing around a bit with SPLV, and I like it a lot. I had actually thought about replacing VBLTX with SPLV but just hadn’t gotten around to it. I’ll try that tomorrow and see what happens.
yeah but why bother when you can get higher returns with Fidelity select funds (20% CAGR) using the seasonal trading?
I’m still not sure what seasonal strategy using Fidelity Select Funds you are referring to?
Isn’t it too simplistic to say that bonds will go down in the future and therefore shouldn’t be considered in this (or any) strategy? Don’t we need to consider the yield? The VBLTX currently has a yield of 3.99%, and if interest rates go up (bonds go down) the yield will rise on the bond index as well, increasing the yield and recapturing some or all of the drop in asset price.
The yield probably won’t recapture the change in price in the event of a decline — look at the price/yield of the 10-Yr T-note from July 2011 and July 2012 — 07/11 it was $121.90/3.22% and 07/12 it was $133.38/1.61% The yield payout changed by $1.61 annually and the price went up $11.
The yield should be factored into the results, but an increase in yield would only soften the blow (a little).
I think the equity curve paints an interesting picture — look at the curve pre-2008 and post-2008. Pre-2008 rates were moving up and down and the curve is gentle (by eyeballing it, 100% appreciation in 12 years). 2008-present you’ve got a 150% appreciation. Wood — what’s the breakdown of S&P vs. VBLTX yields in those two periods?
You are correct – I think the rule of thumb is if you look at the duration of the bond fund, that is the length of time you need to hold it after interest rates go up for the higher yield to outweigh the lower price. So a long term bond fund could give you capital losses for quite a few years before you broke even.
Okay, I ran the same test from 6.20.1996 to 10.31.2008. That last date is the date of the highest drawdown. After that date, the system really starts to scream. CAGR during that period was 10.62%. $SPY earned 6.84% and the rest was VBLTX.
Okay, for the period 10.31.2008 to 3.28.2013…
CAGR is 26.77%. $SPY earned 16.03% of that, meaning VBLTX contributed over 10%.
Buy n Hold of $SPY from 10.31.2008 to 3.28.2013 yielded a CAGR of 11.53%
And as Bozo pointed out, all these are adjusted prices, meaning dividends are not reinvested.
It probably is too simplistic. But that is why I ask these questions. It is very helpful (for me at least, maybe not for everyone else) to hear differing opinions.
The yield absolutely should be considered, but since we will be holding it for only 6 months, we can only expect to capture half of it, correct?
I would probably use a GNMA fund when not invested in stocks; my second choice would be a investment grade corporate bond fund. The stable value fund is a great idea, but 401k providers are having a hard time getting insurance companies to write GICs at decent rates. One of my 401k plans sent out a letter hinting that the stable value option is under review – my guess is they might limit it in some way.
There is still a lot of upside in bond prices; they just need to get down to Japanese levels 🙂
BTW, it looks like your chart uses S and P price only rather than total returns (with reinvested dividends). I tried to duplicate the results and that seems to be one difference.
I like the idea of a corporate bond fund and will have to explore a few.
They do use dividend adjusted prices. I’ll find a TR index and use that next.
if the spy is below the 200day during the spy period does the strategy long the bond fund?
Yes, anytime it is not long $SPY it is long VBLTX.
How about VCIT- intermediate corporate bond
Thanks, I’ll take a look at it.
Mebane Faber mentioned a strategy like this, and I believe he went back 80-100 years. He was comparing being in the market above the 10 month MA, and when it’s below, move to US 10yr bonds vs cash. The 10yr strategy outperformed the cash strategy, with a little more volatility. I don’t remember the exact figures.
I’m currently doing this strategy in my 401k, however I wonder if it will really work the rest of my life. I believe it’s worked because the US has been the dominant superpower the past century, and will that last the next 50-60 years? I think we can safely assume that both bonds and stocks can fall if an economy truly falls out of favor.
Wow, that’s a curve ball! Yeah, I don’t know if the US will remain the dominant superpower, and honestly, considering such is really out of my comfort and zone of expertise. But I definitely understand your concern.
As for Faber, I love his strategies, books, etc. Great stuff there! His white paper about TAA hit me at a time when mean reversion was underperforming, and I was looking for other options. It really solidified the for me the power of momentum. For years I had traded breakouts, but trading momentum is different because I am not focused on being right for one event but instead being right over a period of time.
So if the SPX was under its 200 SMA on the first trading day in October, but then got above it in, say, December, would the system then get long until the last trading day in April?
Yes.
Fantastic work, I’m sure there are ways to tweak it and make it even more effective – such as levering up when the spy is above the 30day and selling below. Are you still using Amibroker? I would love to tweak this and share the results
Sure, I’ll email you the .afl
Is the email address you put into the comment field correct?
Yes, thanks
Here we are, a dozen interested and knowledgeable commentators, that are keeping a close watch on the market, and dozens more who are reading without commenting…. and not a single person has said “Oh, yes, I’ve been using this strategy for a couple of years now”. Looks like we need not worry about this strategy becoming too popular and affecting the returns any time soon.
Good point.
I agree. We incorporated it into our strategies in 2010… worked to a T… however, the Bernank and other CB’s out there muted its results by the time the end of October rolled around they had announce new QE’s (Jackson Hole Sept 2010) or said the will “Do whatever it takes” – ala Draghi Sept 2011 or QE4Ever Oct 2012)…. we were killing it but when the October statements went out, the market ripped higher the weeks leading up to it… so although it greatly reduced volatility…the outperformance was hard to come by ….. my advice to all looking into this strategy DONT WAIT TIL OCTOBER TO GET BACK IN…. there are excellent indicators to use (oversold, crossovers etc)
Hi BV !
A tad late to comment, but anyway:
could you point me to excellent indicators to use ?
I read cxoadvisory.com and other sites that test the usefulness of indicators and see them get ripped apart and left as useless.
Wood, you should check out Sy Harding’s “Seasons in the Sun” timing strategy for sell in may. He uses the MACD to time the spring and fall buys and sells and does very well with his strategy. Here’s the link.
http://www.streetsmartreport.com/sts.html
Thanks, Dave, will do.
Hi Dave
Steve over at CXO Advisory did test this last year. Link: http://www.cxoadvisory.com/2640/calendar-effects/simple-test-of-sy-hardings-seasonal-timing-strategy/
Good stuff Wood. For a longer backtest you need data. There is a long running “Dow Jones Corpoarte Bond Index” that goes back a ways (it had some significant adjustments about 7 or 8 years ago, when it had been called the Dow Jones 20 Corp Bond Index). Data may not be freely available but I have about 35 years of weekly closes on that one.
There is interest rate data that goes farther back freely available but I don’t know how to convert that into a price series?
The St Louis Fed (the FRED) has government, Moody’s corporate yield data going back many years.
If you figure out how to make this a price series I’d be very interested.
I think it is fairly simple to convert into a price series by using an excel sheet? I’ll look into it. I think AmiBroker will accept a .csv file to fill in price fields.
Woody, I read somewhere, a while back, that real estate etf’s or mutuals are a good choice for the summer period.
Wood and Kill the Banks said..””There was some blogoland chatter a few months ago regarding the “max theoretical gain” left in bonds (forget if it was the 10yr or the 30yr) and that number being around 17% total net or so (IIRC). Sentiment seems to be that given the current interest rate situation the only direction rates can really go is up, which translates into “bonds down”.””
I completely disagree. I am a firm believer in the Japan 2.0 scenario for us here in the USA. I am convinced that the 10 yr. Treasury will yield 1.0% in a few years. if so, there is a LOT of upside left in these bonds. I wish I had a nickel for every time someone said that rates can only go up from here! Ha! Economist Van Hoisington has been right as rain so far (for many years) and he calls for this too. I think the IEF might be the instrument to trade off this.
Sorry, I meant to say that “Wood SAID that Kill the Banks said”
Hi Woodshedder:
May I ask you how often you execute the strategy… I mean do you execute this strategy each month end or at the close of each trading day. Your results will vary based on how often you execute this strategy.
Hey wood, I never got this strategy in my email – I was thinking about substituting in a market neutral income fund instead of the vanguard fund. Also trying it with other indexes besides the SPY and the 250 day moving average instead of the 200