On Wednesday, May 15th, $SPY closed 3.52% above its 20 day moving average. While this has happened more than 275 times over the history of $SPY, it is not an altogether common occurrence. It is the first time this has happened in 2013, and it did not happen at all in 2012. A quick glance at the list of these events appeared to show some clustering.
So what happens next? Let’s take a look at what happens over the next 50 days.
The Rules:
- Buy $SPY at the Close when it Closes > 3.5% Above its 20 Day Moving Average
- Sell X Days Later
- All $SPY history used
- No Commissions or Slippage included
The Results:
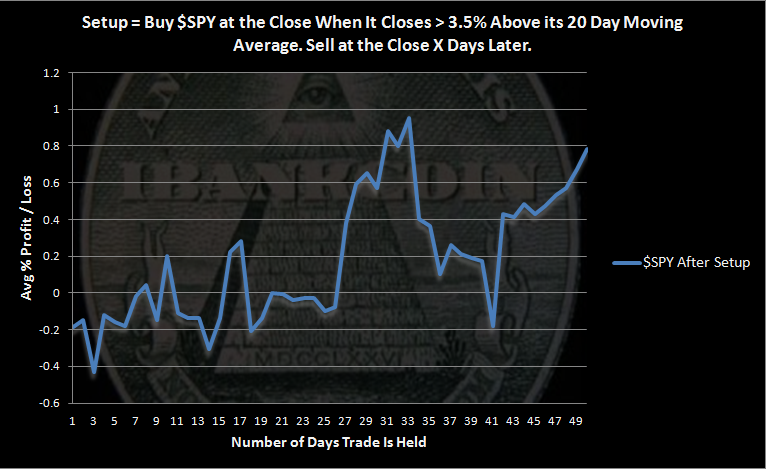
While there were 275 occurrences, if we instead look at trades, there were 169 trades held for 1 day and 35 trades held for the full 50 days. This means that there is some clustering occurring. It also means that the further we go out towards 50 days, the more volatile results become, simply because there are fewer trades to average together.
The graph shows that this setup is neutral to slightly bearish. The return is no where near to matching a buy-n-hold return over the same time period. In fact, the return after this setup is about half of what we’d expect after holding $SPY for 50 days.
With $SPY having closed 10 days in a row above its upper Bollinger Band (50,2), many traders are expecting some consolidation. Others are calling for a fairly serious pullback. These results show that in the past, consolidation has been much more likely than a serious pullback.


One comment
Pingback: Daily Wrap for 5/16/2013 | The Whole Street